.png)
Software Engineering Intelligence
-
Intelligence Engine
On-demand exhaustive AI-analysis
-
Engineering Investment
Complete visibility into time & dollars spent
-
360º Insights
Create meaningful reports and dashboards
-
Project Forecasting
Track and forecast all deliverables
DevEx
-
Developer Surveys
Create and share developer surveys
Software Capitalization
-
R&D Capitalization Reporting
Align and track development costs
Allstacks | Release Roundup | January-March 2024
Learn more about what's recently shipped in Allstacks and stay up to date with the latest and greatest that the platform has to offer in our release roundup from January-March 2024.

Hello again from the Allstack's product team! It's time for our regularly scheduled release roundup. Updates include new and improved sprint attainment widgets, the first iteration of our Work Items Table, the option to use dynamic filters on the portfolio report, and general improvements to help you get the most out of the allocations metrics in Allstacks.
Get more details on each of the capabilities below.
Take advantage of new and improved sprint attainment widgets
You now have the ability to create dashboard widgets that measure the total committed vs completed work across sprints in a faster, more intuitive way. This includes work that’s added and removed during sprints. These new sprint attainment widgets help you and your teams understand the ratio of committed vs. completed work over time; A good way to think of this is in terms of “what did we say we’d do vs. what did we complete” during sprints over a given timeframe.
Why is this important?
- Teams can now see how addition and removal of tickets during sprints impact the overall success of their sprints.
- Teams that are primarily focused on hitting their original sprint commitment can continue using the original version of the widget.
- These new widgets provide visibility into the total amount of committed vs. completed work across any number of teams to easily identify bottlenecks and improve predictability.
Sprint attainment widgets show the total amount of committed vs. completed work
Welcome a more powerful Work Items Table (WIT) into Allstacks
You now have the ability to query tickets matching a set of rules and see those items on your dashboards. These dynamic lists can be created on the new Work Items Page and pinned to a dashboard from there.
Why is this important?
- The WIT provides a more powerful way to filter data in any way you want to view it, displaying the most pertinent information as a column in an easily consumable way without needing to interpret data presented in chart form first.
- Enables you to create better visualizations using the data displayed in the WIT after generating the list of work that’s most important.
- Provides a new, natural, home for displaying risks that relate to specific work items in one place.
Customize your WIT to display a list of tickets based on the filters or rules you define
We recommend using the WIT to identify certain initiatives that need attention in combination with risks in Allstacks, creating more opportunities to be proactive about potential blockers or bottlenecks before they intensify. Below are sample use cases that we recommend test driving with the WIT. Use the WIT to view:
- Epics and initiatives in flight on your dashboard with the option to toggle between teams and see project filters update accordingly.
- Stories and tasks that are stuck on your dashboard with risks that respond to changes in project filtering.
- Newly created bugs that need to be triaged.
- Bugs with an SLA and may need attention, for example things like all P1/P2 bugs in progress.
- Newly created issues that aren’t attributed points yet and need refinement.
- Recent items that were closed or in a “won’t do” state with the reason they were closed.
- Epics that haven't been updated in 60+ days in combination with risks.
An example of the WIT generating a list epics currently in progress
Start using dynamic filters on the portfolio report
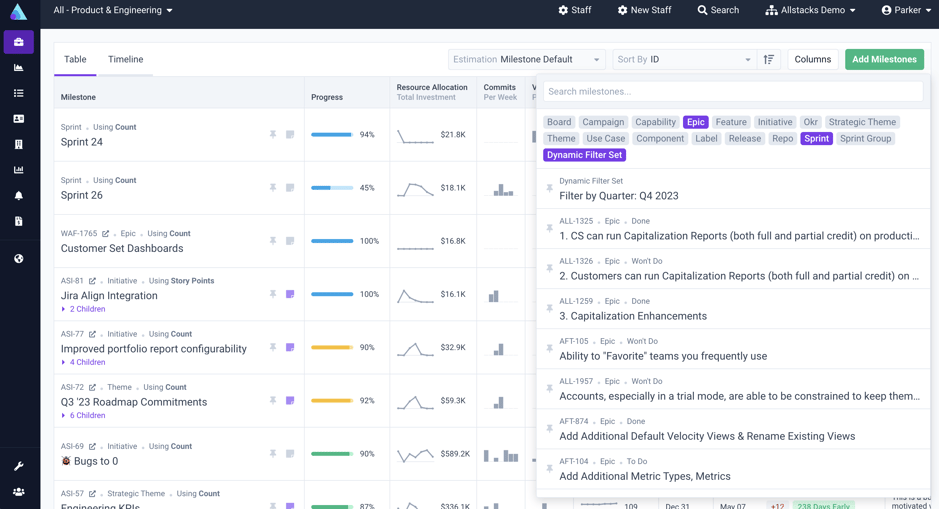
Now, you can add dynamic filters to your Portfolio Report that populate your portfolio automatically based on the rules you define. Here's how:
- After you've created and saved a filter for any dashboard, click the "Add Milestones" button in the top right hand portion of the Portfolio Report screen and select "Dynamic Filter Set" in the gray options in the top of the drop down.
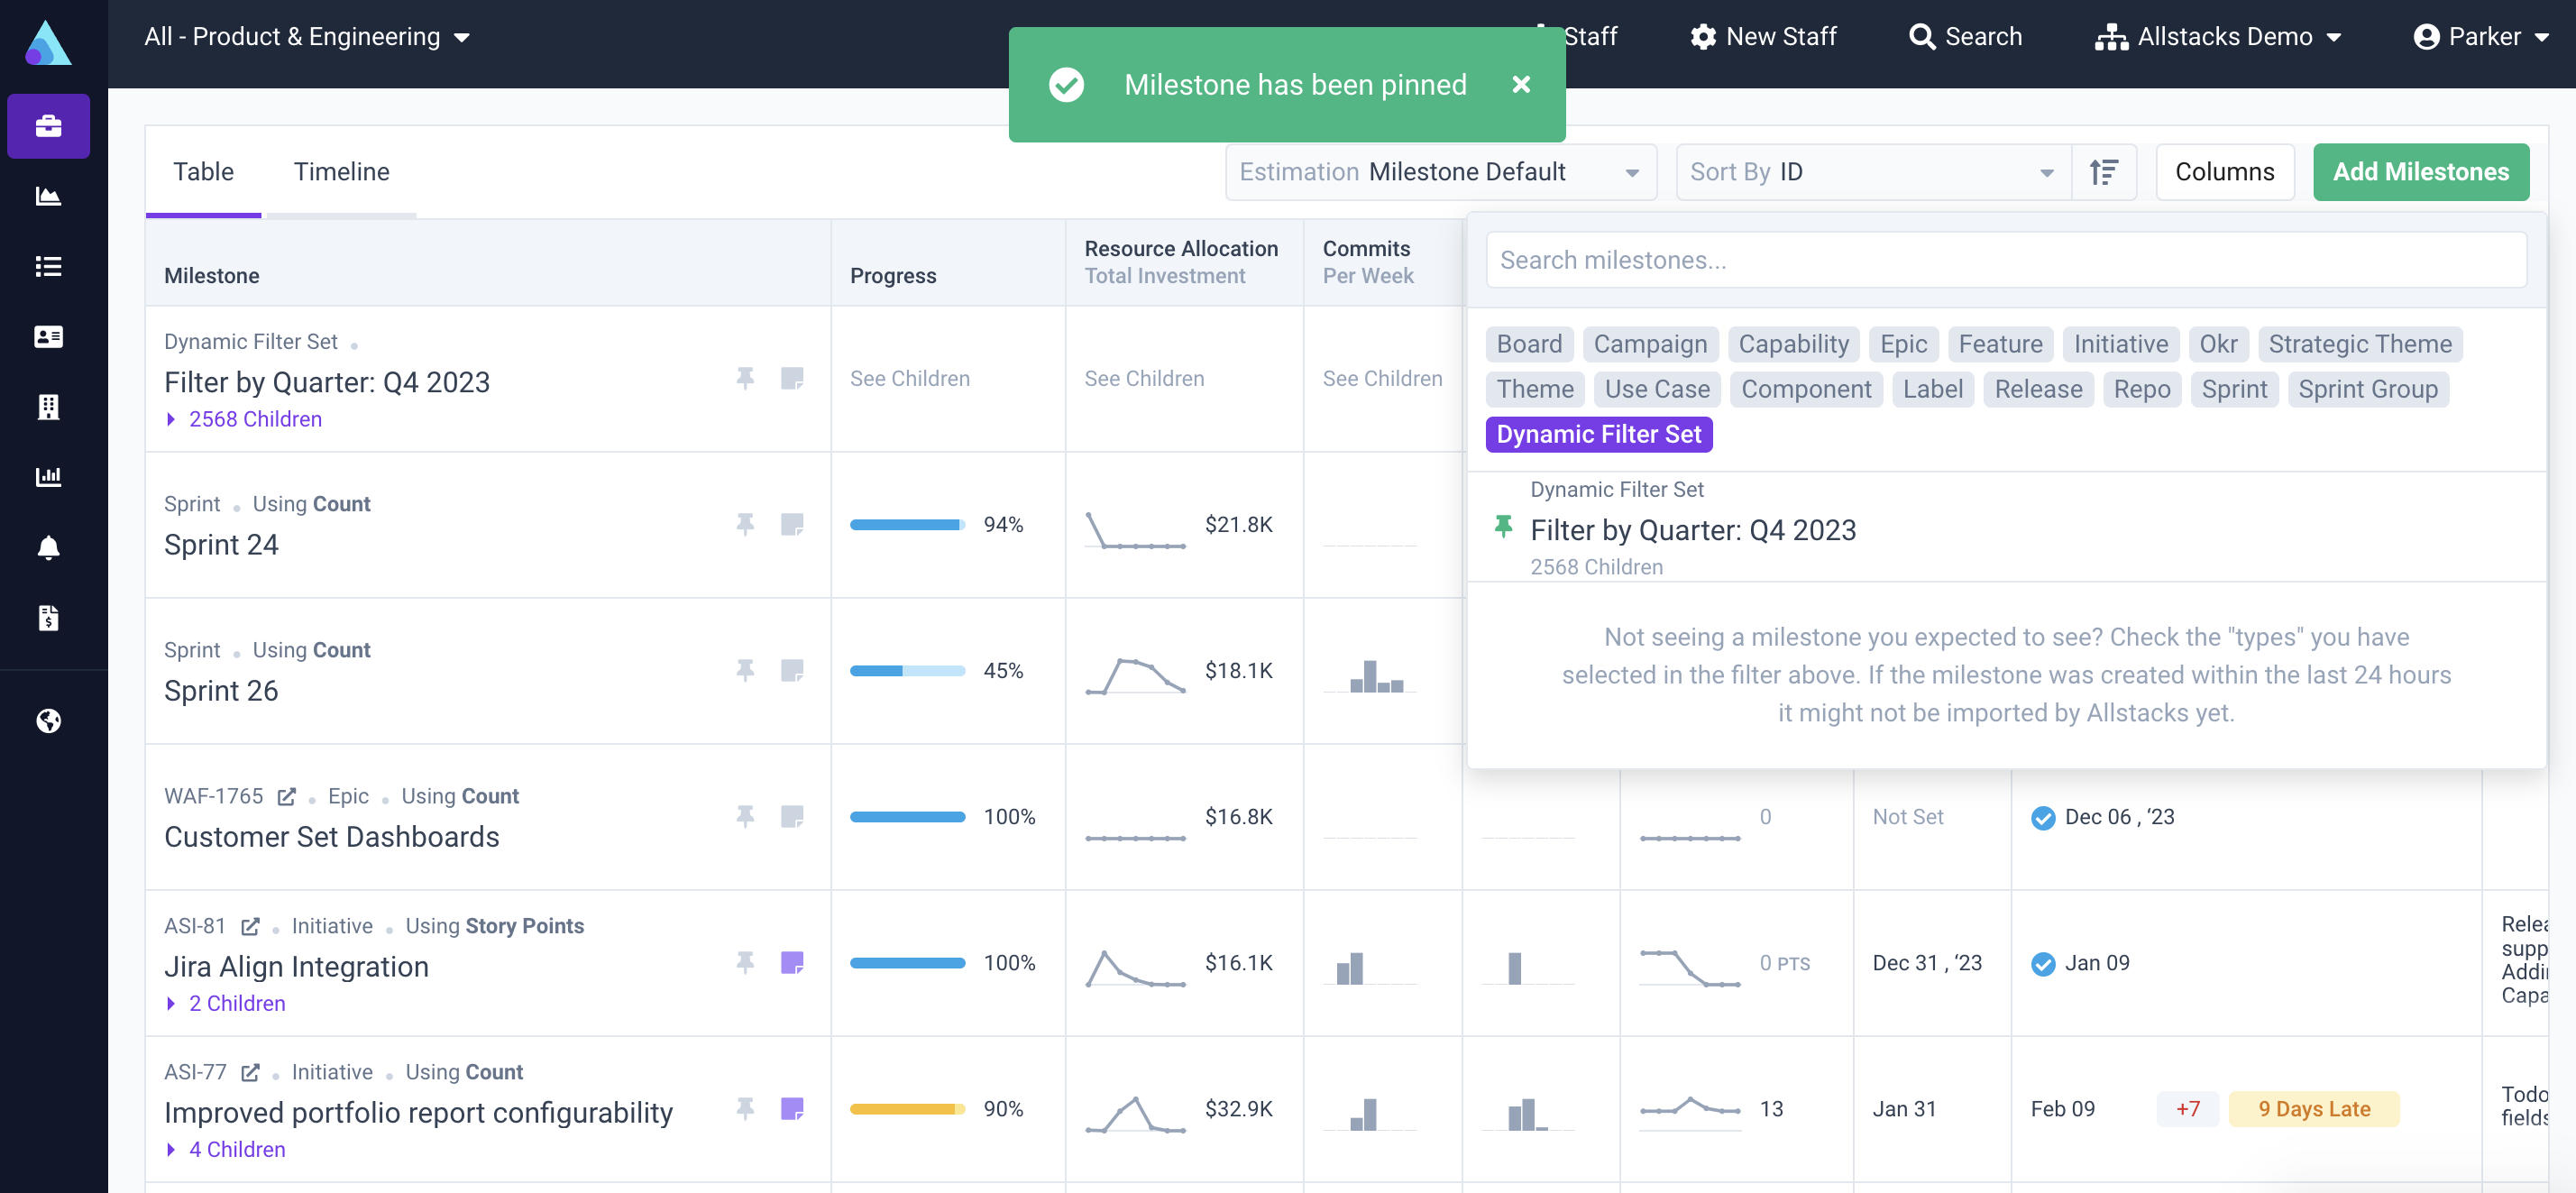
- In the same drop down, your saved dynamic filter sets will display next the thumbtack icon(s). Choose the dynamic filter set you'd like to add to the Portfolio screen, and those changes will be automatically reflected.

Create and customize dynamic filters for your portfolio report

Pin your dynamic filter and see the changes reflected immediately
Why is this important?
- You no longer need to maintain your portfolio report manually. Create as many rules as you need to keep your portfolio populated automatically with the work your team is doing.
- Use Allstacks as your source of truth to track key initiatives without altering your existing workflow.
- Easily create parent items for deliverables that don’t exist in tools like Jira/ADO and group epics or initiatives together by category or theme, all without requiring new fields to be made in your source tools.
Get complete visibility into engineering investments with resource allocations
In the fall of 2023, we announced the beta release of resource allocations metrics in Allstacks that allows for estimating development costs based on engineers’ average salaries and the hours invested by them. Since then, we’ve made substantial updates to improve the overall UX and expand what resource allocations can provide in the app to view your engineering investments through a new paradigm, enabling you to better understand how you’re delivering and quantifying value.
Here are updates:
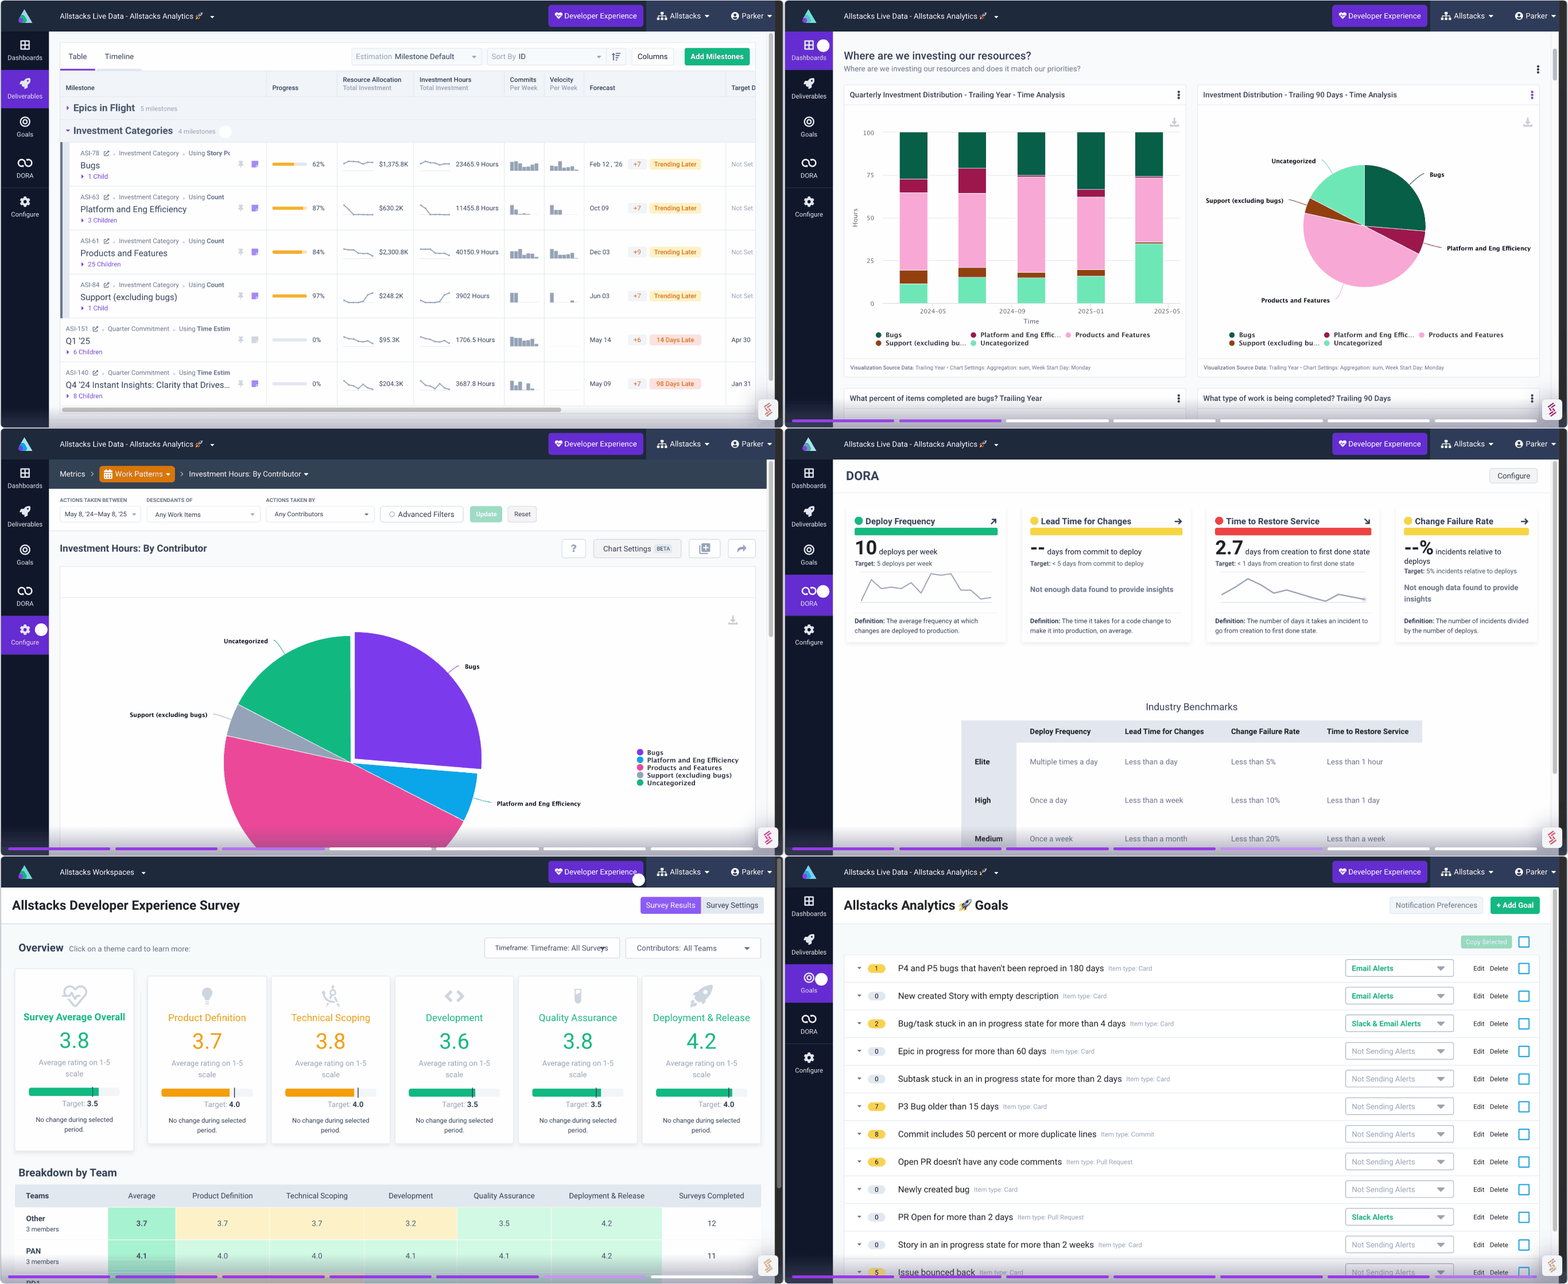
- Investment hours and allocations metrics can now be pinned to the portfolio report as columns and organized to display in whatever order you see fit.
- Customers can now set different salary rates for their contributors using tags, so that allocation metrics can be more precise.
- Other general improvements include:
- Increased the allocation and investment hours metric history to 5 years instead of 2 years.
- Allstacks now connects commits to tickets more accurately, improving the allocation calculation and also making commit metrics more accurate when grouped by parent tickets.
An example allocation metric based on work categorization in Allstacks
Why is this important?
- Know your ROI: Get a clear line of sight into your potential ROI and payback when working on a given feature or deliverable based on real financial data
- Build with confidence: Understand where you’re investing resources, both human and financial, to determine what to build or what not to build with a higher degree of confidence in the potential impact the work will have on the business at-large
We hope you enjoy these improvements! If you have any questions about this or any Allstacks functionality, don’t hesitate to reach out to the Allstacks team. Keep an eye on the release notes regularly to see what’s new.

