Introducing the new Work Items Table (WIT) in Allstacks
Learn about the new Work Items Table in Allstacks. A new, powerful way to generate dynamic lists of deliverables that matter most to your teams.
We’re proud to announce the availability of the WIT in Allstacks for all customers! This new functionality allows you to view specific tickets on your dashboards based on matching rules that you specify, making it easier than ever to create exhaustive lists from powerful filters and see important information quickly.
Get WIT it, Allstacks style
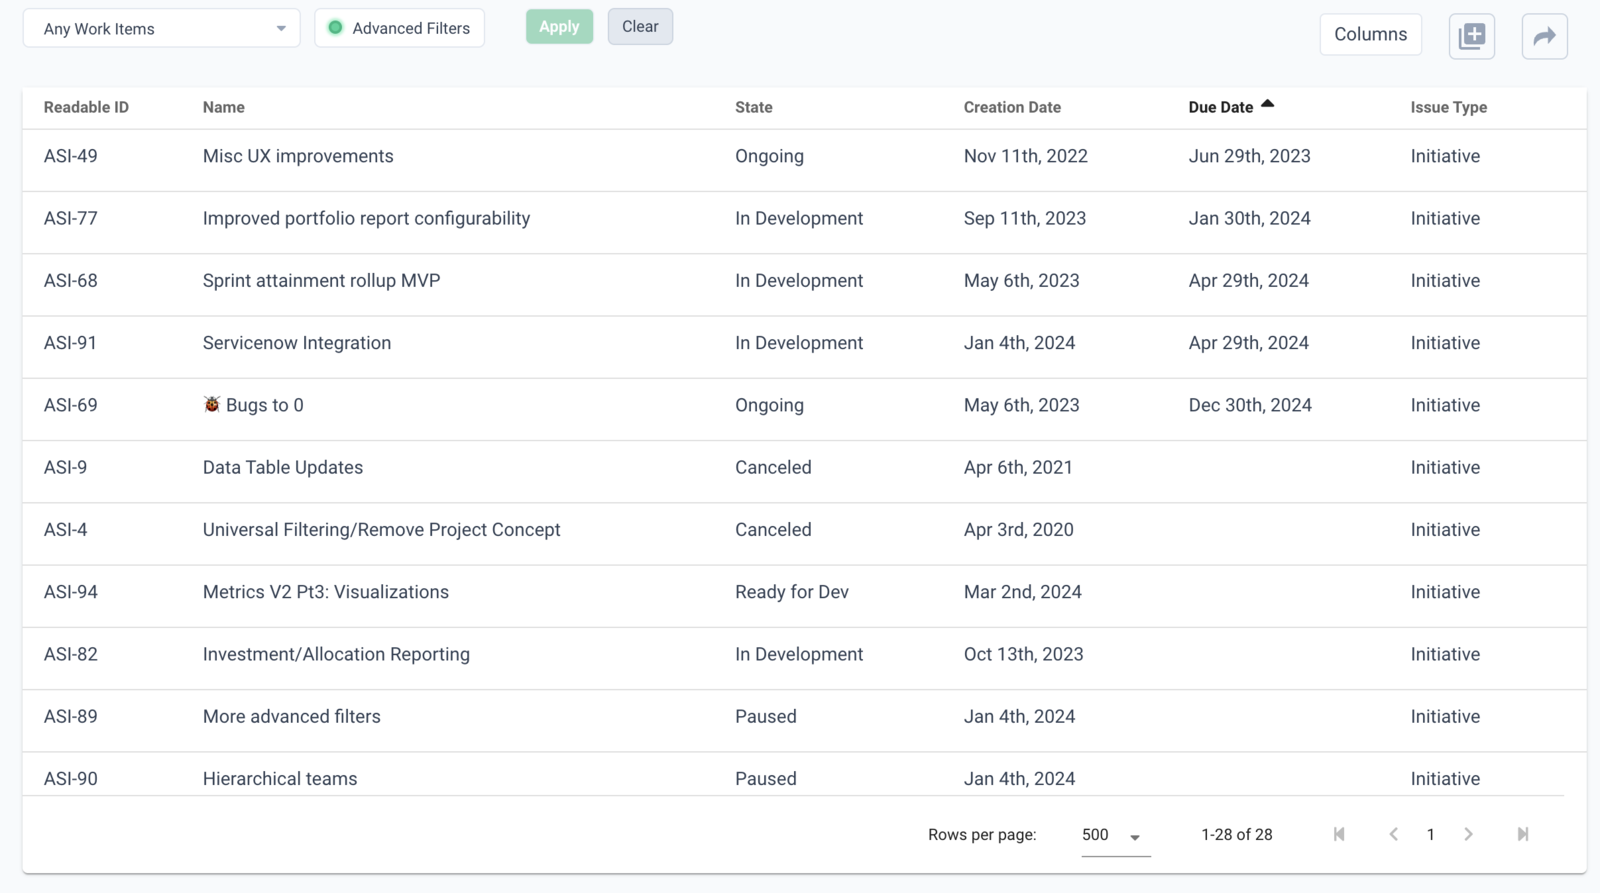
Use the WIT to generate a dynamic list of deliverables that matter most for your team and quickly aggregate a list of work items to identify where action needs to be taken. The columns shown in the table can be customized to show just the properties that are important for your use case.
Check out example of what the new WIT looks like below.
What can I do with the WIT?
This new way to display and consume information in Allstacks helps you view aspects of your workflow in a way that elicits action, such as understanding exactly what initiatives/epics/stories are in progress and need extra attention, identifying deliverables that are in progress but aren’t being prioritized properly, and investigating velocity or commitment trends to quickly identify the most important areas to focus on in terms of capacity planning.
How to create your first table
Find the steps to create your first table in Allstacks below, along with a video walkthrough that overviews how to generate a list of all active initiatives using the WIT.
- Click “Work Items” in the left side navigation in Allstacks
- Use the work items picker and advanced filters to select the type of information you want to display
- Click “Done” after choosing the work item filter you want to use
- Click “Save” after creating advanced filters
- Click “Apply” next to the advanced filter picker
- Validate that the information in the WIT is displaying correctly based on your filters
- Click “Columns” in the upper right hand corner to enable or disable specific columns
- Click “+ Add” in the columns drop down to include anything that’s missing
- Name your WIT and pin it to any dashboard of your choice by clicking the “+” icon next to the “Columns” button in the top right hand corner
Tips and tricks to make the most out of the WIT
You can use the WIT to create all sorts of rules and save the results to your dashboards where they will refresh every day with the latest items matching those rules. Here are some ideas to try:
- Epics and initiatives in an “in progress” status. Use dashboard filters to quickly winnow the list to deliverables belonging to specific teams or larger bodies of work.
- Stories and tasks that are stuck. Use dashboard filters to see just the items pertaining to a specific team or milestone.
- Newly created bugs that have no priority and, therefore, need to be triaged.
- Bugs with an SLA and may need attention, for example things like all P1/P2 bugs in progress.
- Newly created issues that aren’t attributed points yet and need refinement.
- Recent items that were closed or in a “won’t do” state with the reason they were closed.
- Epics that haven't been updated in the past 90 days.
What’s next?
This is only the beginning of what we’ve got in store for the WIT in Allstacks! Heading into the future, we envision a world where you will be able to use the WIT as a catalyst to create visualizations that can be easily pinned to dashboards and customize portfolio views with saved filters using the WIT table data as a starting point. This will further streamline the process to view, consume, and interpret the most important data in the way that works best for you and your teams.
This will make the WIT extremely helpful when generating a very specific list of items and customizing how the information is displayed, but also provide new way to create visualizations efficiently from a preexisting data set. This will help to minimize any guesswork that’s involved when otherwise creating visualizations from scratch and provide cross-functional teams with the right level of visibility and focus into specific bodies of work.
What would you like to see next for the WIT? Let us know!
Table of contents


/ get started /
