Allstacks Release Roundup, March-April 2023
Get a quick summary of release highlights in March and April 2023 and a preview of what’s to come on the product roadmap!
At the time of writing this, our Allstacks product and engineering teams shipped a total of 24 releases from March 1st - May 1st, 2023. Quite impressive, although this doesn’t come as a surprise if you regularly check out the Allstacks release notes page. What you didn’t know is that we’ve shipped everything from new functionality, to various bug fixes (both major and minor), to general product improvements aimed to improve your quality of life and provide a smooth UX.
I’m going to briefly overview the highlights over the last couple of months so that you can take advantage of the latest and greatest that Allstacks has to offer.
Updates below include more flexibility to edit metrics and dashboards quickly, additional filtering options, and a new metric to measure teams’ ability to deliver on sprint commitments based on percentage, plus more. Let’s get into it!
Quality of life, usability, and general UX improvements
Enable or disable columns on the Portfolio Report
You can now hide or display the most relevant columns on the Portfolio Report to easily filter what information you see on a more granular level and prioritize the data that matters most in a couple of clicks. Do this by selecting which columns are visible on the portfolio report under the “Enabled Columns” button, as seen below.
Note that updating the visible columns will only impact your current selected team/workspace.
Edit widgets directly in the dashboard
Gain time back in your day with the ability to quickly edit and save any changes to metrics on your Allstacks dashboard without additional steps. To do this, select the kebab menu on the top right of any metric and select "Edit Metric.” From there, update any filters or chart options and select “Save.”
Date range filtering on dashboards
You can now override the date range and apply a milestone or project filter to all metrics on a dashboard. This straightforward change gives you more flexibility when viewing metrics, as pictured in the screenshot below. All you have to do is select the dashboard you’d like to override, select the date range and milestones/projects, and hit “Update.”
This update helps you filter and get to the data that matters in fewer clicks. Reporting that previously required multiple dashboards and several variations of the same core metrics may now be done from a single dashboard with a simpler core set of metrics, filtered on demand to report on different teams, different initiatives, or different time periods.

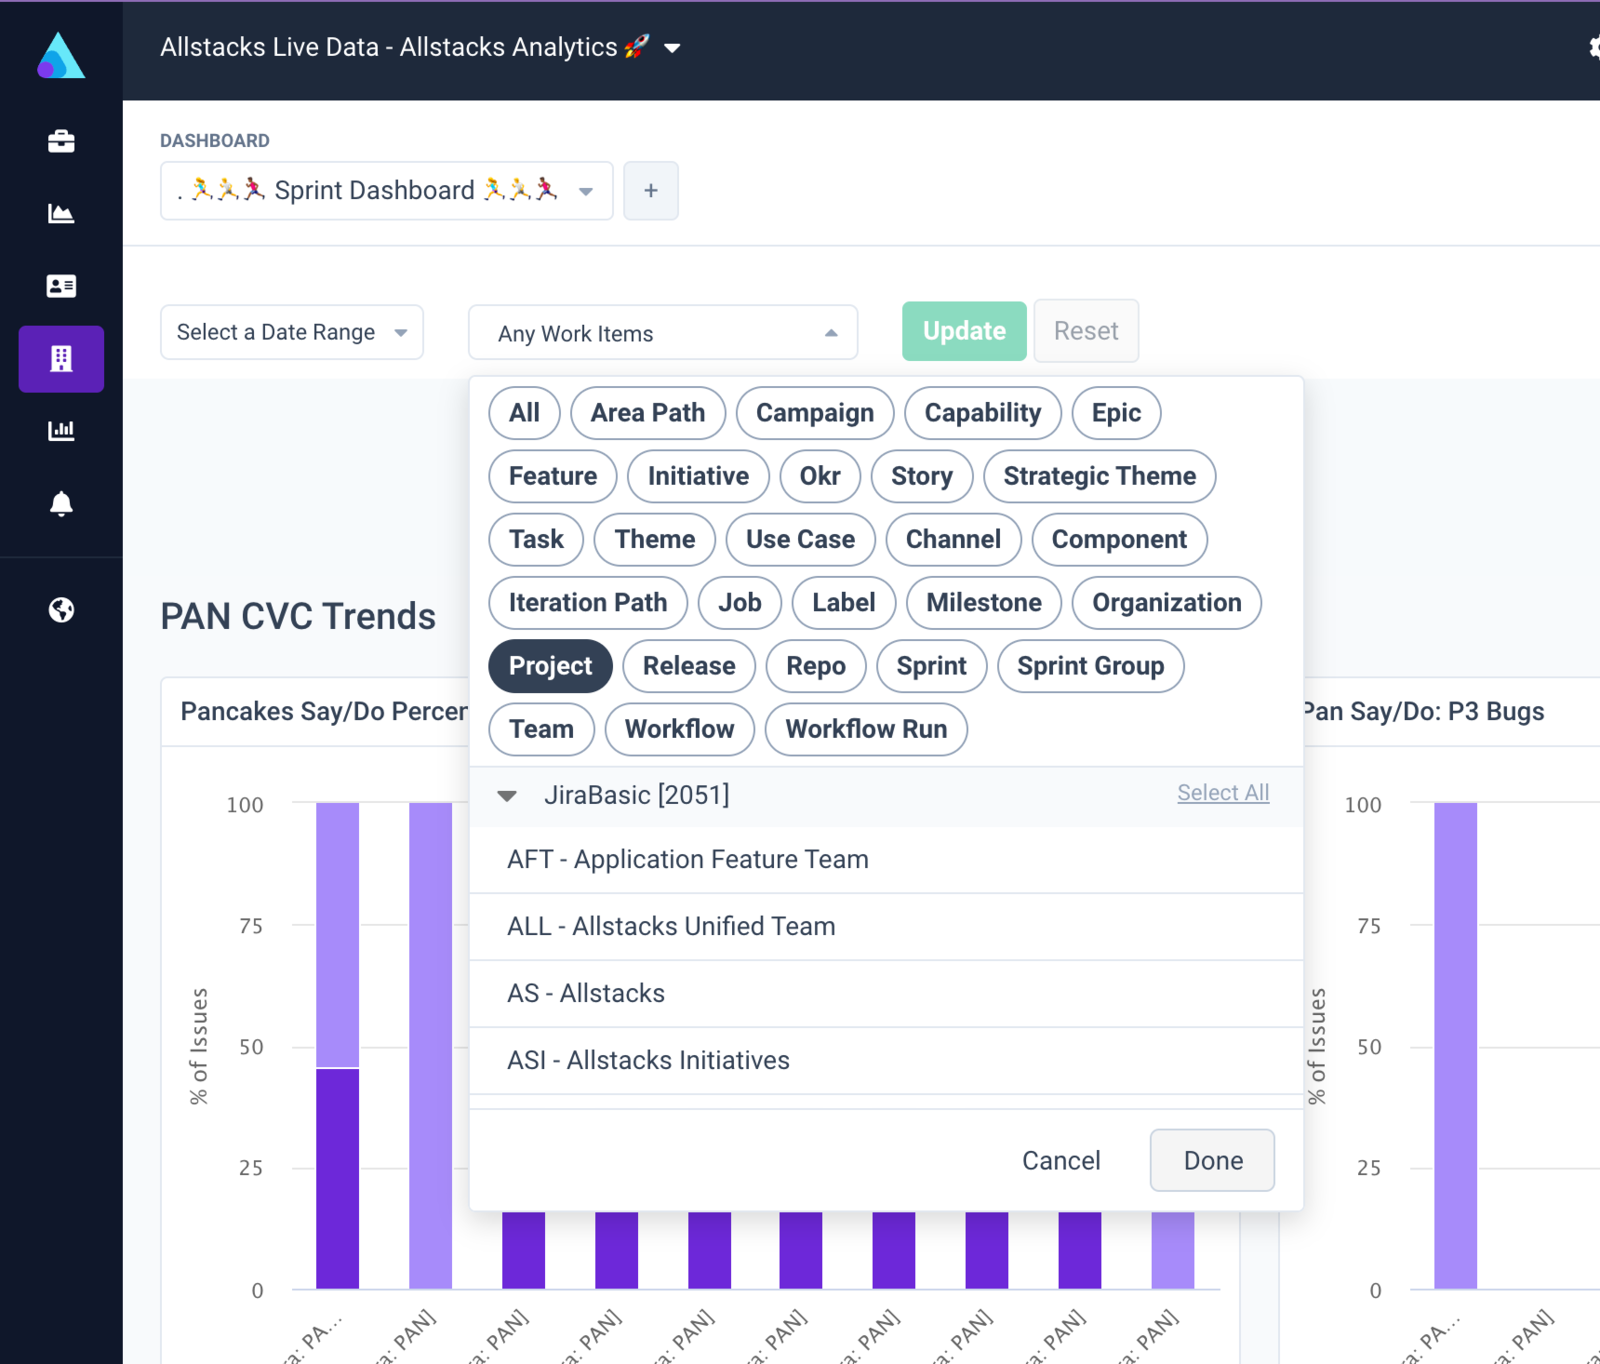
Filter by work item on the dashboard
A newly added filter allows you to view work items by category for any dashboard that you’ve created. To find this, go to your dashboard, select the dropdown that says “Any Work Items” next to the date range selector, and click “More” in the top right-hand corner to see the full list of available filters that you can choose.
Not only is this a significant quality of life/UX improvement, but it also lets you easily reuse dashboards and quickly switch between different teams or projects. Many customers have been asking for this functionality, so we’re excited to share this one.
View sprint attainment on a percentage basis
We’ve added a new metric for viewing sprint attainment on a percentage basis. You can find this view in our metrics list under Process Health > Committed vs Completed > Say vs Do Percent or by searching “percent” and choosing “Committed vs Completed.” If you have one team per Jira project, simply plug the project name into the “Descendants of” filter. If you have projects in which multiple teams have sprints, you’ll need to select the individual sprints in the “Descendants of” filter when you want to see just one team’s sprints.
This update helps you establish a baseline to march towards so that you can better understand your team's ability to predict what they can deliver – “What did we say we’d do versus what did we actually accomplish?"
- Engineering and product can plan, refine, and better predict work and stay aligned on commitment versus execution.
- Sprint attainment is easier to view and predict. You can quickly extract meaningful insights based on trends over time.

Added an “Uncategorized” series when grouping metrics by users and their tags
When using tag grouping, items that have users associated with them and don’t have tags in the selected category will be grouped under “Uncategorized.”
Before this update, when grouping by user tags, unassigned service items or items associated with someone who didn’t have this tag were excluded from the source data table.
This improvement helps you comb through data more effectively and reduce clutter when grouping metrics by users and their tags. It will also help you identify areas where data hygiene or process adherence can be improved in your workflow based on the proportion of uncategorized work as you group metrics and view them in different ways.

What’s next on the product roadmap
In the spirit of transparency, here’s a look at our top product priorities in the coming months. This isn’t an exhaustive list of upcoming work. Priorities, as well as timing, are subject to change.

We welcome feedback on the roadmap and our product team would love to hear from you.
Miscellaneous improvements and enhancements
In an effort to keep our pipelines humming along nicely each night so that your data arrives fresh and ready to view each morning, we’ve increased build concurrency for our nightly pipeline runs to download import data more efficiently. We also fixed an issue that made the portfolio report unsortable for some customers, along with various other stability/performance enhancements that can be found in the release notes.
Bugs and hotfixes
Last but not least, here’s a preview of the bug fixes and hotfixes that were provided over the last couple of months. Squashing bugs can feel like a thankless task, but it’s an integral part of the equation, so I wanted to make sure to call out the great work done by our engineering team to ship these fixes in a timely fashion.
- Fixed a bug preventing the use of custom properties for grouping data in metrics
- Fixed a bug that caused some metrics to not be fully editable when accessing them through a dashboard
- Fixed a bug that caused null values to be labeled incorrectly in metric axes
- Fixed a rare issue causing missing links between Jira tickets
- Fixed a bug on the milestone report, ensuring that the stories table lists the correct items
- Fixed a bug that caused cards with multiple links between them in Jira to become unlinked in Allstacks if one of the links was removed even if other links between the two items remained.
- Fixed a bug causing the employee management page to be very slow when enabling contributors
- Fixed a bug causing tickets from different PM tools to show as linked in Allstacks
- Fixed a bug in chart settings for metrics grouped by parent items by default
- Fixed a bug causing deleted items in Jira to still show as linked in Allstacks
- Fixed a bug where stacked bar charts could show an incorrect axis label
- Fixed a bug preventing the deletion of teams
- And many more…
Again, don’t forget to review what’s recently been shipped on our release notes page, and feel free to contact us with any questions, comments, or concerns. Cheers!
Table of contents


/ get started /
