.png)


Strategy & Thought Leadership
What are DORA metrics? In this article, we explain the four main DORA metrics and determine if they’re actually effective for engineering performance.

The attendees were a diverse group of IT leaders from various industries, including eCommerce and software development. Despite their different backgrounds, they all agreed that the measurement of engineering productivity "depends" on various factors, such as the company's maturity.
Predictable suggestions emerged: commits, velocity points, number of pull requests, throughput, and so on—all metrics we’ve looked at over the past ten years, and all contextually “dependent” on the audience, namely how technically savvy they are.
However, as I left the panel and heard other attendees discussing their own "it depends" metrics for engineering productivity, I realized that I believe such metrics should not depend on anything, including the team, the consumers of the metrics, or the context of the product. Both non-technical board members and highly-technical contributors should be able to understand and use the same language to assess the engineering team's productivity.
And that language is DORA.
What are DORA metrics?
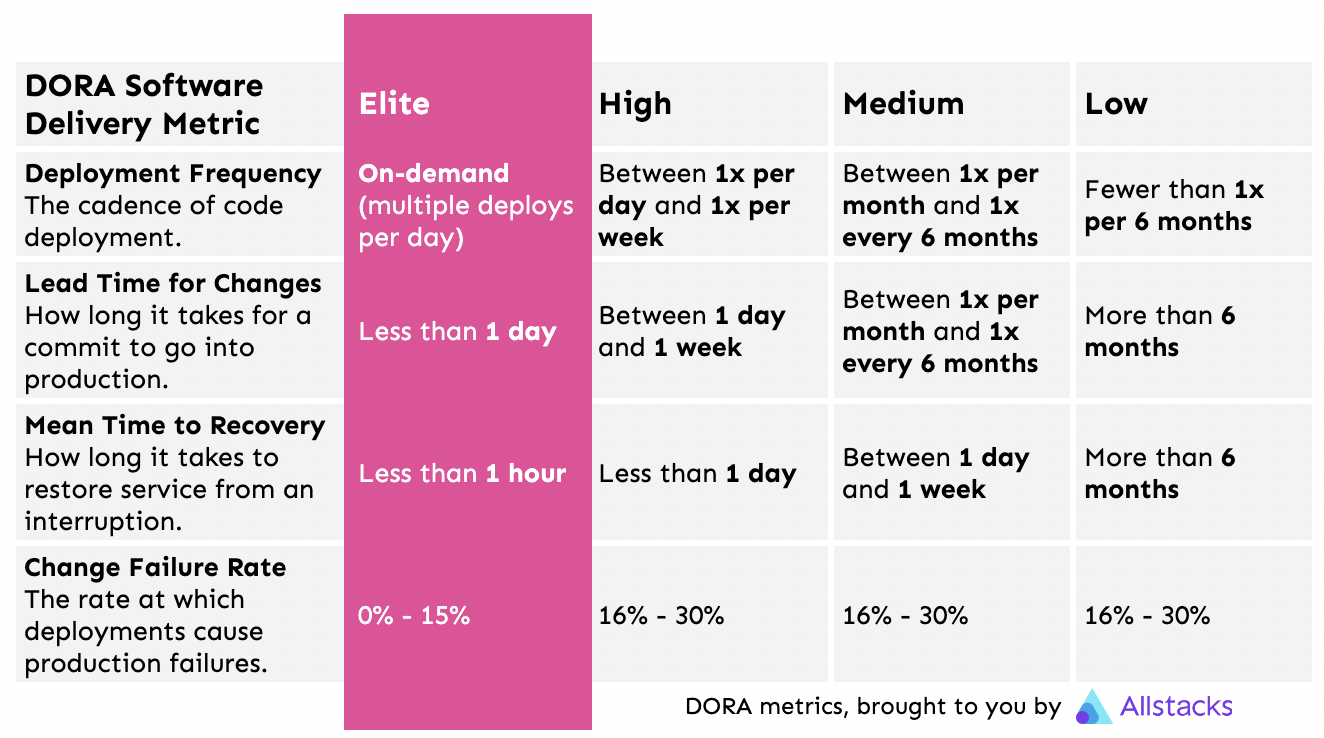
DevOps teams use DORA metrics to score the team’s efficiency, from “low” to “elite” performers. Four metrics make up the DORA framework:
- Deployment Frequency: The cadence of code deployment.
- Lead Time for Changes: How long it takes for a commit to go into production.
- Mean Time to Recovery: How long it takes to restore service from an interruption.
- Change Failure Rate: The rate at which deployments cause production failures.
To be fair to the panel, they might not have heard of DORA metrics yet. Its namesake, DevOps Research and Assessment LLC, was a digital transformation research organization that Google acquired in late 2018. Their annual longest-running research campaign, “State of DevOps,” tracked what made high-performance teams tick—and why some teams predictably fail to deliver. After years of collecting this data, the group published Accelerate: The Science of Lean Software and DevOps. In it, they identified the metrics that best informed and anticipated those high-performing organizations.
In other words, DORA’s founders—Nicole Forsgren, Jez Humble, and Gene Kim—took the guesswork out of which productivity metrics were actually worth tracking for engineering leaders.
Let’s dig into what each of these measurements means, what they look like in practice with DORA dashboards, and how an IT leader can improve each.
1. Deployment Frequency
How often is your team deploying code or releases to its end users? Whether you’re measuring your deployments by months, weeks, days, or hours, deployment frequency provides insight into how continuous your organization actually is.
Allstacks provides multiple ways to customize and gain insight into your deployment frequency. For example, if a CTO wants to zoom out to a monthly overview of deployments in a DORA dashboard, they can use Allstacks to achieve that top-level view or analyze their deployments on a daily level.
%20Deploys%20to%20Production-png.png)
Allstacks DORA metrics: Deployment frequency
Other useful views from this DORA software include commit frequency, merged pull request velocity, and velocity by team. These additional views helps appraise leading indicators of your ability to deploy to production.
Regardless of how you slice the data, DORA defines elite teams as those that deploy multiple times per day, and low-performing teams as those that deploy fewer than once every six months.
Knowing your deployment frequency is like learning your mile time; you might be proud of your pace, but it requires strategy and diligence to improve your run time. And that strategy will differ if your starting pace is 16 minutes, 12 minutes, eight minutes, or sub-six.
Similarly, elite teams achieving continuous deployment can use a tool like Allstacks to monitor emerging bottlenecks and leverage alerting to proactively manage outliers that could keep a team from maintaining high performance, while low-performing teams should examine if they really have the infrastructure for continuous deployment.
2. Lead Time for Changes
Lead time for changes, sometimes known as “change lead time,” tracks how long it takes a team to start a change request to final deployment to the end user—it’s a measurement of velocity and overall team efficiency. If you were to track just one DORA metric because you’re hand-calculating these figures with spreadsheets or cobbling them together through JIRA, GitHub, and CircleCI, this would be the one I recommend.
Lead time for changes isn’t a static metric; like deployment frequency, you must select over what time period you’re measuring your lead time, and take the mean number of commits over several periods.
For example, monthly lead time for changes can provide helpful context for board meetings, whereas weekly overviews might be more helpful for sprint reviews.
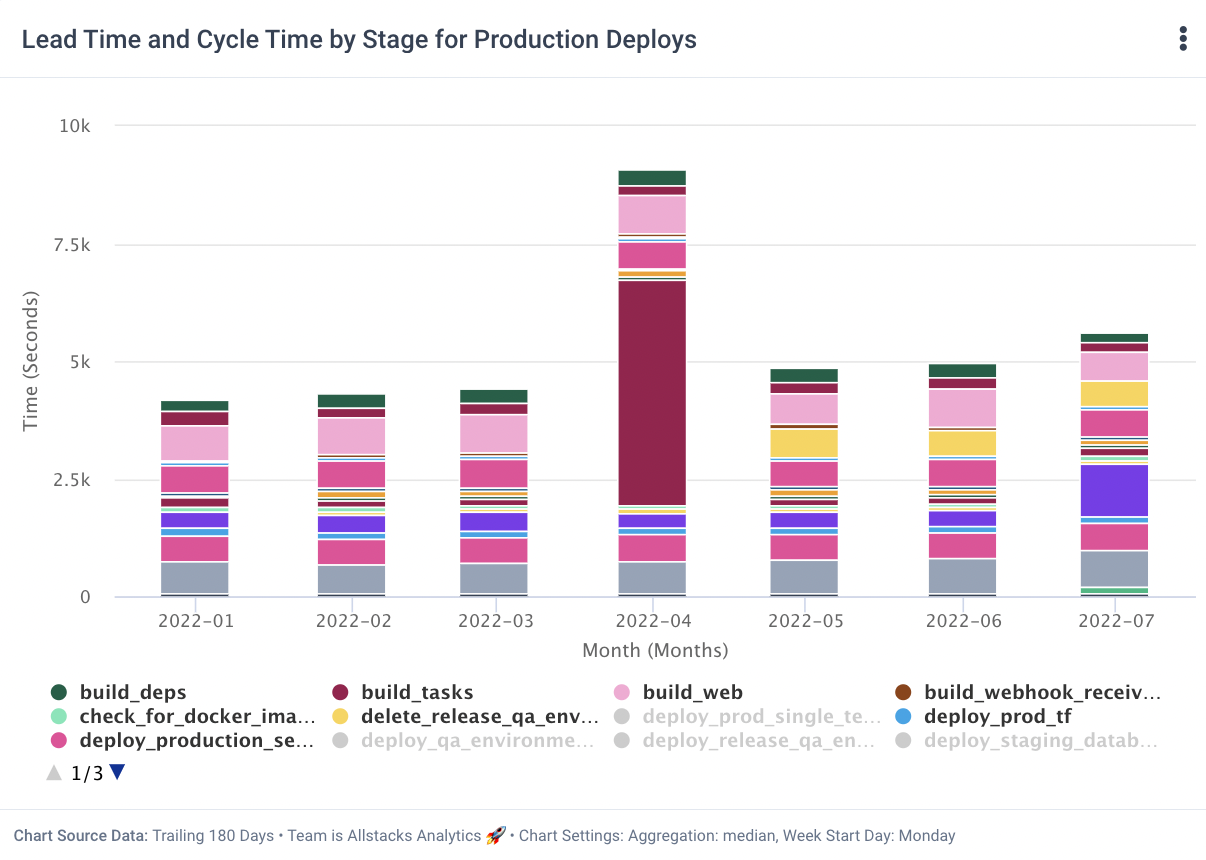
Allstacks DORA metrics: Lead time for changes displayed by pipeline stages
The most elite DevOps teams deploy an impressive lead time for change in under an hour. Meanwhile, low-performing DevOps teams can take longer than half a year to effectuate a single change.
Though advice abounds about how to improve your lead time for changes, the most immediate, impactful insight I have for you is to take a close look at your team infrastructure. Engineering sludge—manual testing, legacy-derived frankencode, and silos between developers and QA— create long lead times (and also miserable teams). There’s no quick fix, which makes monitoring lead time for changes while executing change management on the strategic level is essential for keeping your contributors focused and engaged for the long term.
3. Mean Time to Recovery
When the team inevitably experiences an unplanned outage or service disruption, mean time to recovery (MTTR), which is sometimes called “Time to Restore Service,” measures the average time it takes to restore service.
Calculating mean time to recovery is fairly straightforward; sum up all the downtime over a specific period and divide it by the number of incidents. For example, your system went down for four hours over ten incidents in a week. Four hours is 240 minutes. 240 divided by ten is 24, so your mean time to recovery is 24 minutes over that week time period.
When calculating engineering performance, DORA metrics reveal that elite teams resolve their outages at breakneck speed: in under an hour.
MTTR is a mixed engineering metric. It’s great for baselining your engineering team’s efficiency, but it doesn’t unveil where in your process you have a problem. For example, if your QA isn’t responding to requests, or your alerting system holds off for weekly round-ups, a tool dedicated to identifying MTTR can’t piece together the nuances of a slower MTTR time.
Still, there are some best practices for improving MTTR. Those include:
- Document your incident response plan.
- Make sure your CI/CD system automates testing and alerting for incidents.
- Cross-train your team so that absences don’t create a single point of failure.
- After an incident, follow up to figure out why it happened and if it’s preventable in the future.
4. Change Failure Rate
How often do your code changes result in an incident? Change failure rate answers this question as a percentage: the number of failed deployments over total deployments in a defined period of time. Change failure rate differs from failure rate, which includes incidents that occur after deployment (typically when a user does something that has nothing to do with the development process).
At Allstacks, we contextualize change failure rate with successful merge or completion rates for PRs and issues to forecast the overall likelihood of successful work.
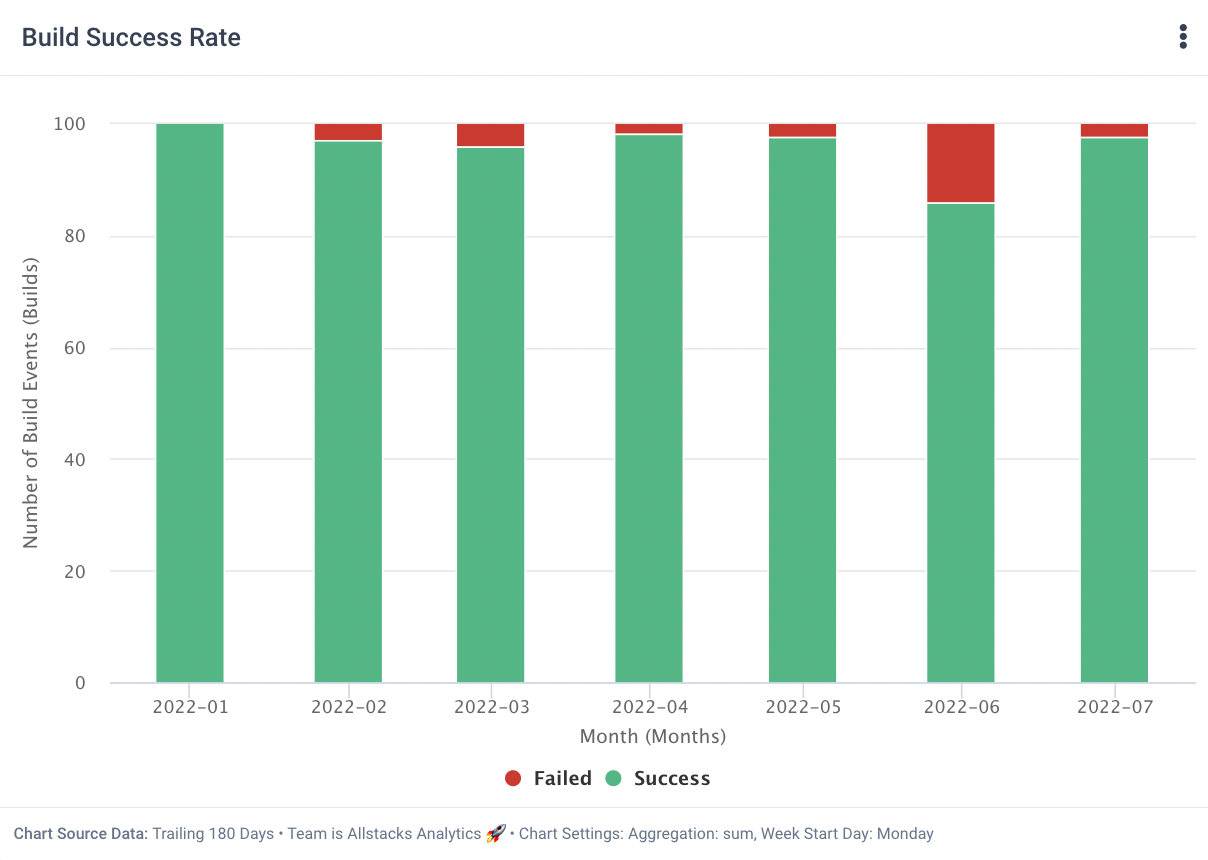
Allstacks DORA metrics: Change failure rate
While it would be nice to live in a world where our change failure rate is zero because we encounter no incidents, that’s not a reality for any software organization I’ve been a part of. DORA defines elite DevOps teams as those who keep their failure rate under 15%. By DORA’s standards, high, medium, and low-performing teams all have change failure rates between 16% and 30%, meaning that either your team is elite or not; no other subcategories matter.
Improve your change failure rate with two tricks.
First, break down your processes into smaller bites. That means more frequent, smaller deployments, which makes it easier to track down bugs to a specific version.
Second, extend your review processes for merge requests. Reduce or eliminate ad-hoc code changes to the project repository without purposeful review.

Who should avoid DORA metrics? Who should use it for engineering performance?
I’d be lying to you if I said I believed all Star Wars movies were good movies. I’d also be lying to you if I claimed that all teams should use DORA. No mind games here.
Here’s my checklist for teams who shouldn’t use DORA:
- You’re small, with maybe less than 20 developers, and your business is changing quickly. DORA metrics work best for steadier companies that can baseline effectively.
- You’re not really practicing DevOps. If automation is more of a theory than practice, DORA will make it clear that your team is behind elite performers. Save your money and focus on improving your CI/CD pipeline.
- You plan to use DORA for individual performance reviews. DORA metrics can really only reveal how a team is performing; when you start slicing down to the individual level, you lose the necessary context for evaluating their performance.
- You have structural issues that prevent continuous development, like a customer base that can only accept changes once per quarter. You can still leverage DORA for engineering performance… but the metrics need to be tailored to your span of control.
- Your developers are burnt out from a shitty culture. DORA won’t fix their productivity for you.
And here’s my unicorn checklist for the perfect organization looking to improve engineering performance with DORA:
- Your IT organization has over 100 contributors, from developers to QAs to product owners.
- You have a generative work culture. Indicators of this environment include high levels of cooperation, willingness to share risks, and an inquisitive (over punitive) reaction to failure. You measure eNPS.
- You have a mature CI/CD pipeline, and DevOps concepts aren’t novel to the team.
- You’ve shifted left on security.
How to get started with DORA fast
If you’re using CircleCI, you can use Allstacks to vet and contextualize your data on our custom dashboards. After you’ve taken two minutes to sign up for a free trial and connect your tools, take three more to get a read on your DORA metrics.
Jeremy, our CTO, will walk you through how.