.png)


Strategy & Thought Leadership
Flow metrics map the software development lifecycle to key business value drivers. Here’s how to improve efficiency, predictability, and prioritization.

Valerie Silverthorne is a journalist turned content marketer focused on the software development/DevOps space.
April 3, 2023
Implemented correctly, flow metrics can bridge the understanding, communication and prioritization gaps by creating a unified language and process around software development that directly correlates with key business drivers. Flow metrics allow development teams and the business side to literally meet in the middle around shared goals that actually measure value. In the end, flow metrics help everyone understand software development *and* organizational priorities better, and the best part? Teams can start where they are without sweeping process changes or reorganization.
That’s all a long way of saying we think flow metrics can be the difference between good and great. Here’s what you need to know.
What is flow?
In software development, “flow” is that state when code creation happens seamlessly and nearly effortlessly. Developers, and actually anyone creating anything, celebrate the flow.
To take a bigger picture view, though, flow can also refer to the entire software development lifecycle, from idea generation or user story to deployment and beyond. In the context of flow metrics, software flow is most often broken down into four stages (known as items) — features, defects, debts, and risk — based on guidelines created in the Flow Framework.
What are flow metrics?
The Flow Framework was conceived In 2018 by Dr. Mik Kersten, using the four software-based flow items (features, defects, debt, and risk) set against five measurement metrics: velocity, time, efficiency, load, and distribution. Over time, some organizations have added a sixth metric, predictability, as suggested by the Scaled Agile Framework (SAFe).
These flow metrics form the basis of a value stream management process that is literally designed to remove anything that blocks (software development) “flow” while ensuring value to the business and/or customers is created. Flow metrics create a high-level view of the software development lifecycle but through a business lens. The end result is a powerful tool that creates alignment, tracks progress and can even forecast risks, all while communicating in a language everyone in the organization understands.
Flow metrics can work with any software development methodology, in any industry, and at any organizational stage, but they’re particularly useful for companies undergoing digital transformation or software development modernization. Also, flow metrics provide not only a 360 view of the SDLC but can also provide historical data, which is often critical to decision-making.
It’s important to understand that, while these are individual metrics, they are quite intertwined and must remain so in order to tell a complete story. Flow load, for example, is something teams can determine only after looking at time, velocity and efficiency, while flow time and flow velocity are the point and counterpoint of an organization’s revenue.
For CIOs, IT leadership, and product management, flow metrics are tantamount to a shared crystal ball containing all of the answers to any possible question. No longer will teams be guided by guesswork and unable to truly answer business-side questions about progress, processes or problem areas; flow metrics will have the answers and the data to allow informed decision-making.
What are the flow items?
Flow items refer to the four parts of the software development lifecycle tracked in a flow metrics system, and these are part of the Flow Framework. These stages are broadly defined but represent both creation of code and also issues that can stand in the way including bugs, security risks, or technical debt.
The flow items are:
- Features, which is the step that involves code creation and the one most clearly tied to business success.
- Defects, which refer to debugging and the time it can take to find and fix errors with the code.
- Risk, which is a nod to the importance of secure, compliant code.
- Debt, or technical debt, which is the item that can take time, energy, and resources away from features development.
What are the key flow metrics?
Depending on the organization, there are either five or six flow metrics in use. Here’s what to know about them.
Flow velocity
Flow velocity is a way teams can track how much has been produced in a defined period of time. Are things accelerating, slowing down, or keeping the same pace? A look at flow velocity will answer that question and it’s a baseline guide to productivity.
Specifically, flow velocity will look at a team’s development backlog (sometimes this is known as “throughput”) and determine what’s been accomplished over a sprint, iteration, or weekly/monthly time frame. Flow velocity that’s increasing is nearly always a positive sign, and a decrease in this metric can mean an organization is at risk of losing customers or having other substantive issues.
Flow velocity, along with flow time, are often known as “money metrics” because they provide a clear-cut way to see both the speed and quantity of value being created for the customer.
Flow time
How much time did it take to deliver a flow item? That’s the question flow time answers. Starting at the beginning and ending at the end, flow time tracks time spent. And it follows more than productive time, it’s all time spent; delays, or periods of inactivity, are generally included in this metric.
Along the lines of “you can’t track what you don’t know,” flow time is a critical team metric for ensuring software features (i.e., value) are delivered to customers expeditiously. Teams want to see this number decreasing, and also can utilize this information to predict future efforts because now they have a way to know how long things generally take.
Every team wants predictability and flow time is the metric to help get there.
Flow efficiency
It can be very hard to judge efficiency objectively, but that’s the aim of the flow efficiency metric. Flow efficiency looks at how much activity (vs. downtime) happens during software delivery. It’s the ratio of activity over flow time.
Teams unable to pinpoint the exact location of bottlenecks can tap into the flow efficiency metric for guidance. A high flow efficiency ratio means there are too many logjams or delays in the system, which could require investigation.
The flow efficiency metric is particularly powerful because it examines the entire process from the idea stage to delivery to the customer, so it takes away the guesswork of exactly where things aren’t being worked on or need to move through the process more swiftly.
Flow load
Setting boundaries can be challenging, particularly in today’s “more is more” software development space. So teams wondering if they actually are doing too much can turn to the flow load metric for concrete answers.
Measuring workloads is always more of an art than a science. Flow load is a way to drill down into a process and see if it is being utilized in the most efficient way. It looks at what a team is capable of by tracking the number of flow items (generally works-in-progress) in play. For example, too many flow items can lead to inefficiency and burn out while too few mean the organization isn’t getting maximum value out of its efforts.
Flow load is very much a “unique to each organization” metric, though, because everything from the size of the team to experience levels and even tech tools need to be included when deciding on the most efficient load.
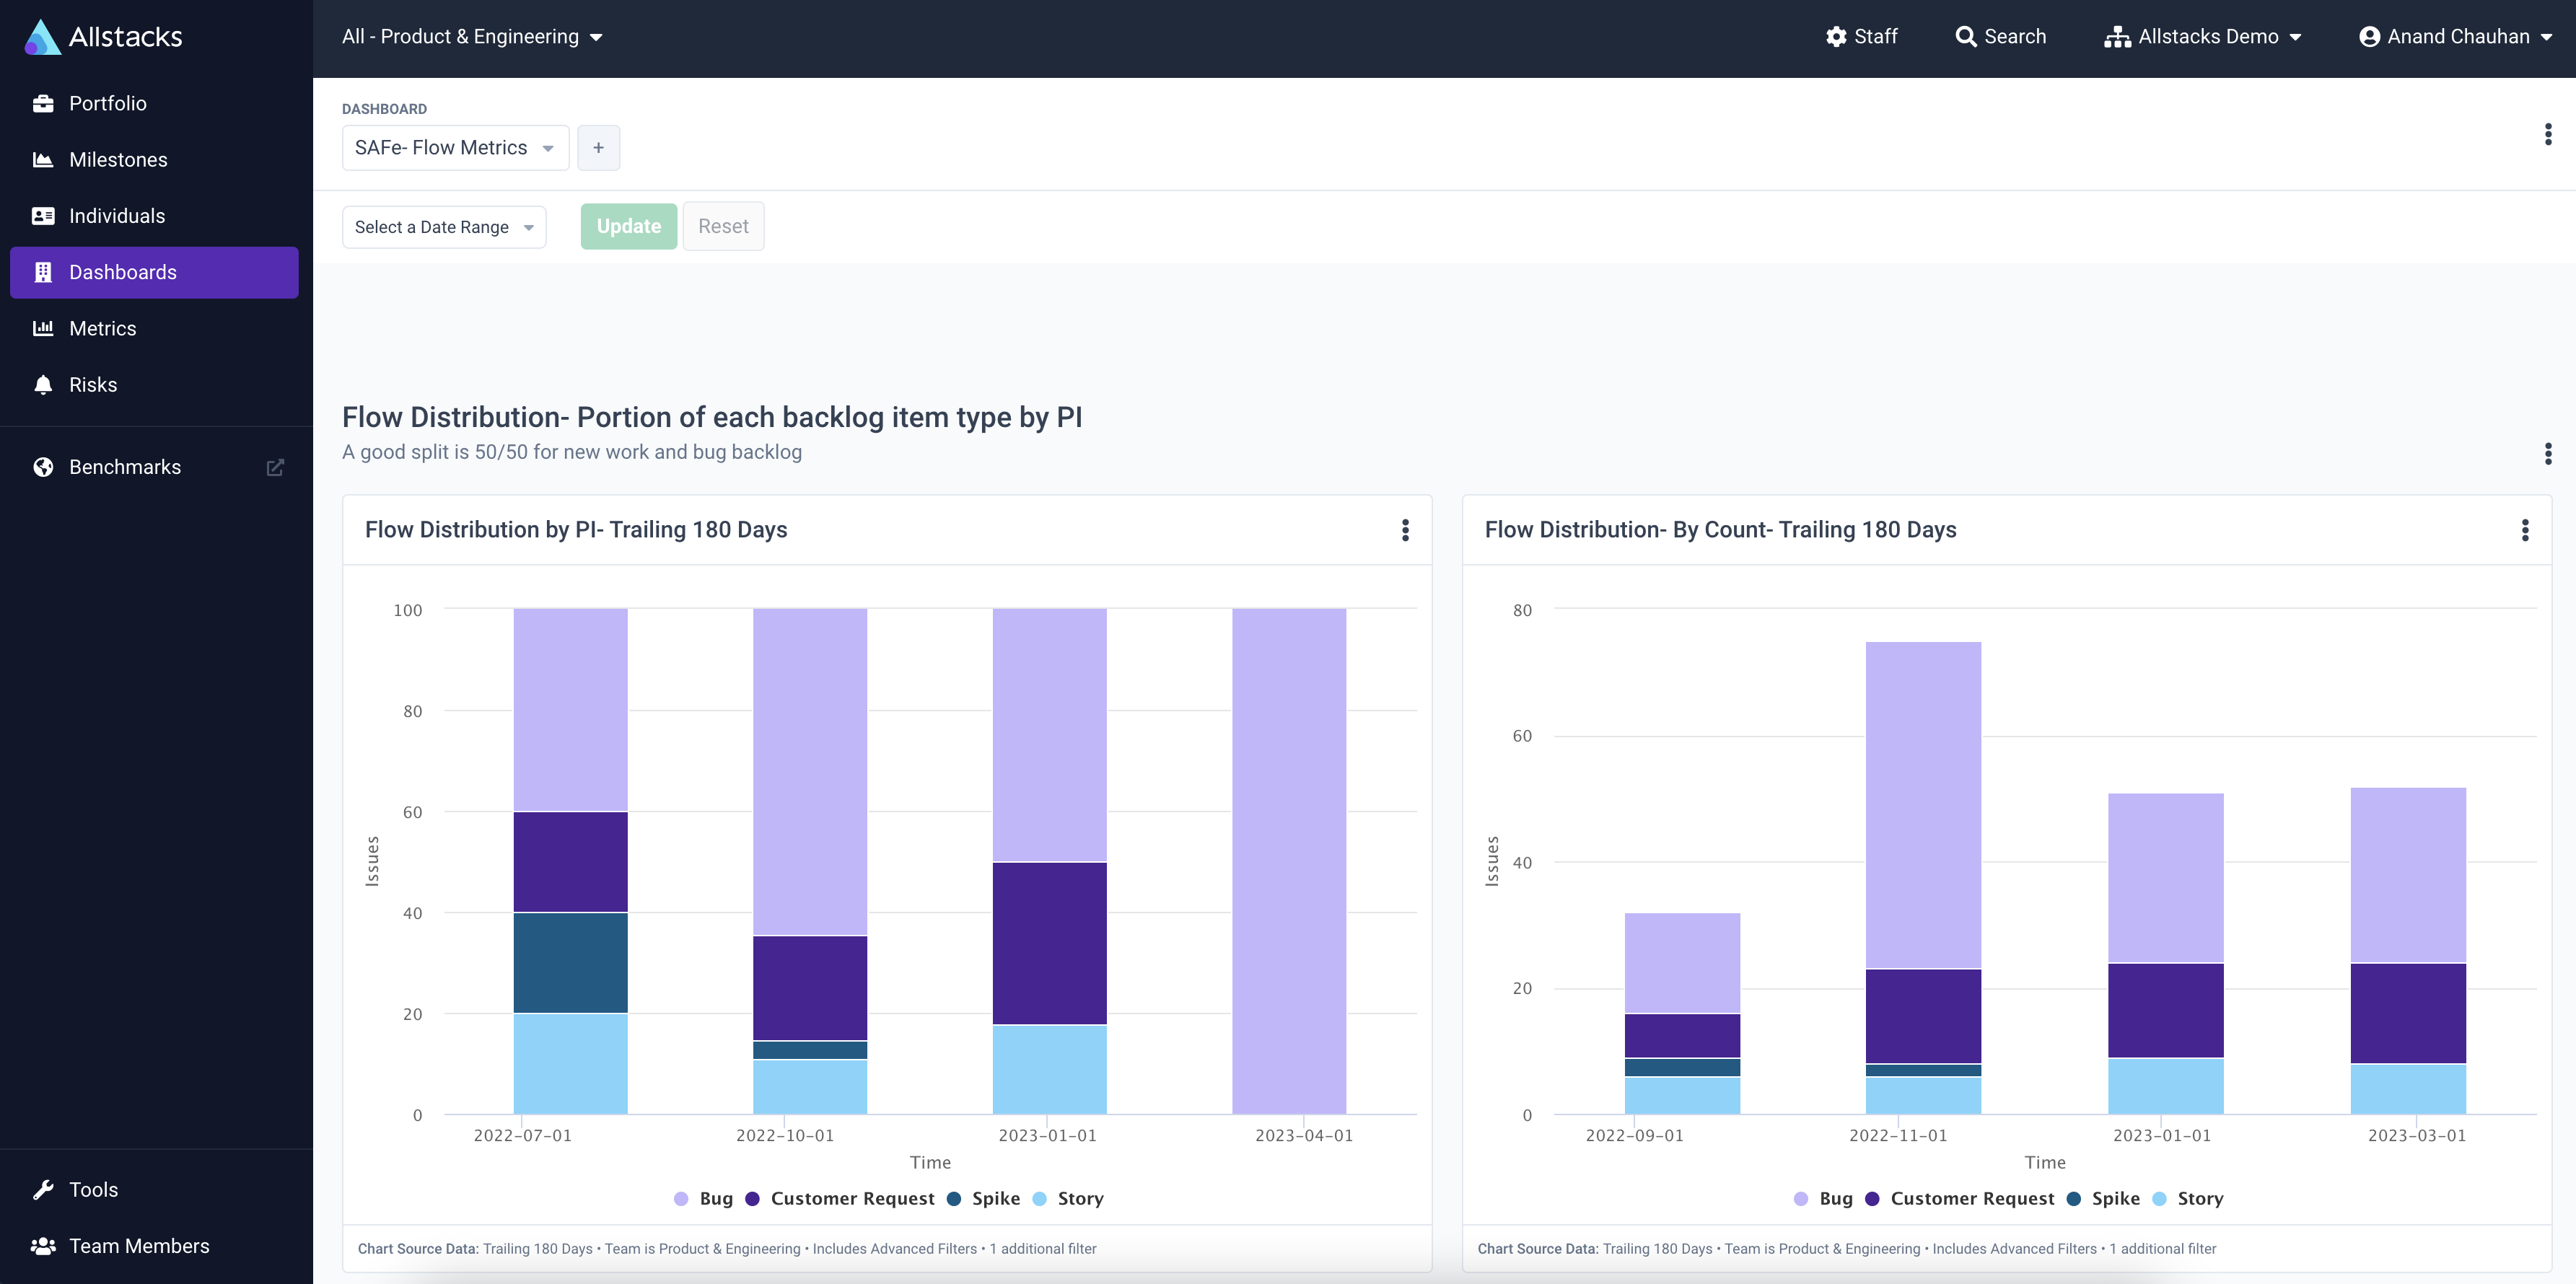
Flow distribution
Flow distribution is a way to help teams visualize and ultimately balance the flow items moving through the value stream. It can be tricky to judge how much time teams should spend on technical debt versus building new features (as one example) and the flow distribution metric is a way to visualize how the workload is divided.
The flow distribution metric also helps teams address what’s often the elephant in the room: the fact that there is only so much work that can be done, meaning tradeoffs are inevitable. Flow distribution makes it easier to balance those tradeoffs.
Flow predictability
This sixth metric, promoted by SAFe, is kind of a summation: how consistently are teams able to meet their goals? Flow predictability can help organizations and managers easily determine performance benchmarks, identify areas of challenge, and tweak the process in order to have continuous improvement. The predictability metric can also be very useful when deciding how to allocate resources and set priorities.
What’s the difference between flow metrics and DORA metrics?
DORA, the DevOps Research and Assessment organization, has created five metrics software development teams can measure themselves against. The DORA metrics are deployment frequency, change lead time, change failure rate, mean time to recovery, and reliability, the last of which was added about a year ago. Many DevOps teams use DORA metrics as best practice benchmarks because they’re specifically tailored to the development process.
Flow metrics incorporate development stages, of course, but take a more holistic view of the entire business to ensure “value” is being created by teams.
That’s all a long way of saying these are different but completely complementary metrics and ideally organizations would use both metrics as part of a continuous improvement value-stream management effort.
What are the benefits of flow metrics?
Flow metrics bring a number of concrete benefits to organizations of nearly all sizes.
With flow metrics, it’s possible to:
- Answer the most important questions. Teams in all industries want to know when something will be completed, and how to make the process better, and flow metrics make it easy to surface those answers.
- Make decisions with confidence. Flow metrics end the guesswork by bringing the data to show where improvements and problems exist. Data-informed decisions are not only easier to make, they’re also easier to explain and defend. Bonus: having the data handy means decisions can also be made more quickly.
- See the entire picture. Visibility into the software development process *and* the business side? Unheard of!
- Reframe the conversation. Development teams are understandably focused on the details and the process, while the business side is trying to sell a fully-fledged product. Flow metrics shift that dialog so that everyone involved is looking at the end result, all the while understanding the conflicting priorities better.
- Offer more accurate predictions. Using historical flow metrics, organizations can confidently predict launches, updates, workflows, and more, based on data.
- Thoughtfully allocate resources. A glance at flow distribution will make it easy for teams to see where and how to shift personnel, investments, and even marketing promotion based on actual workloads, needs, and blockers.
- Tackle employee engagement and burnout head-on. Organizations need all the things and teams want to deliver, but too many priorities (and projects) can lead to unhappy developers. The flow load metric is designed to keep everything balanced.
What are the challenges of flow metrics?
Although flow metrics are an optimal choice for nearly any organization, there are some considerations to keep in mind in order to get the most out of the process.
For starters, the more “mature” an organization is, the more likely it is to experience immediate and obvious benefits from flow metrics. Startups, rapidly scaling companies, or organizations trying to dramatically pivot may find it harder to agree on common goals, language, and processes, which can make it harder to see a quick win from flow metrics.
Doing anything with metrics will of course require planning and alignment throughout an organization. Deciding to roll out flow metrics is a lot like adding a new tool to the stack: some back and forth, some fine-tuning, and a good bit of practice will be required.
And finally, it’s critical that an organization have a stable software development life cycle to build off of. Stability in this case refers to work being started and mostly finished – too much undone work can undermine the flow metrics effort.
Flow metrics really are the secret weapon
Nearly anything that brings dev and business together is worth celebrating, right? Flow metrics does that and goes so much further. Teams can accurately answer the “when will this be live?” question while at the same time not over-investing, burning out developers, or prioritizing the wrong things.
Everyone knows software development represents a powerful value stream - flow metrics allows the business side to see that, understand it, and help make it better.
It’s magic, and it’s not even particularly difficult to do. Let us know if you’d like to learn more about flow metrics.
Learn more about flow metrics
- Here’s how predictive software development works
- Are you up to speed on the latest software delivery metrics?
- Here's a complete guide to DORA metrics