.png)


Strategy & Thought Leadership
This series explores how Allstacks is accurately predicting completion times for software delivery.
/new-Path266.svg)
A team that’s able to minimize surprises and deliver in a repeatable, forecastable way is a team around which you can build a really exceptional organization.
This article is the second in a four-part series that explores how Allstacks is accurately predicting completion times for software delivery. If you haven’t read part one, check it out to get the background and context for following along in this post.
Key Takeaways
Here’s what we’ll cover in this post, at a high level:
- Predictability of software delivery greatly improves by identifying a more precise “start date” for items
- Allstacks can automatically identify each organization’s uniquely defined progress state to improve forecasting accuracy
- Allstacks can update forecasted delivery dates to be more accurate when items are truly being worked on
- Supporting data, such as linked commits and alerts, also provide further improvements to forecasting accuracy
Introduction
Previously, we established baseline results indicating that items associated with one (or more) of our alerts take much longer to complete than items that don’t encounter alerts. As a reminder, the Allstacks alerts are as follows:
- High Comment Activity - alert for issues that have significantly more discussion activity than the determined baseline for issues in your organization
- Late Additions - alert for issues that are added to a sprint after work has already begun
- Bouncebacks - alert for issues that move backward in the primary issue flow
- Over Average - alert for issues that are open longer than the average for issues of that type
- Stuck - alert for issues that are in a stage significantly longer than other issues of that size and type
- Multiple Issues - alert for issues that have 2 or more of the above alerts, or other alerts we generate that aren’t discussed in this post
However, the baseline completion time results were determined through the creation dates of the items. It would be inaccurate to provide completion time forecasts solely based off of the creation dates. After all, the time at which a developer actually begins to work on an item varies greatly. In this post, we’ll examine how Allstacks is using additional sources of data to develop more accurate completion time forecasts.
Data Introduction
Allstacks tracks all of the activity of an item, all the way from creation to completion. This includes two significant data points for forecasting purposes: issue states and linked commits. For example, an item may go through the following sequence of events:
| Item Activity | Date | In Progress |
|---|---|---|
| Open | 1/3/2020 12:00:00 | |
| Ready for Development | 1/6/2020 11:00:00 | |
| Development | 1/7/2020 09:00:00 | Yes |
| Commit | 1/9/2020 14:00:00 | |
| Ready for Testing | 1/13/2020 16:00:00 | |
| Testing | 1/14/2020 09:00:00 | |
| Closed | 1/15/2020 12:00:00 |
As it turns out, we can drastically improve predictions for software completion by determining a more precise “start date” than simply using the creation date.

Specifically, the “true” start date could be defined in one of two ways:
- The first date at which an item moved to a progress state
- The first date at which a commit occurs
Allstacks uses statistical methods to automatically determine each organization’s uniquely defined progress state (since not all organizations use the generic “In Progress” state), as shown in the above table where “Development” is flagged as the first “true” progress state. Additionally, through integration with your organization’s version control platform, we can determine when the first commit occurred.
Now that we’ve provided some context on establishing an item’s “true” start date, we’ll analyze the differences in completion times when using each of the two start date methodologies. Additionally, we will compare the results to the simplistic use of the item creation date from the first blog post.
Data Process
To begin establishing the final results, we pull together a dataset that looks something like the following table:
| Item | Story Points | Completion Time from Progress | Completion Time from Commit | Alert Type |
|---|---|---|---|---|
| 1 | 2.0 | 8.125 Days | 5.917 Days | |
| 2 | 1.0 | ... | ... | Bounceback |
| 3 | 0.5 | ... | ... | |
| 4 | null | ... | ... | |
| 5 | 5.0 | ... | ... | High Comments |
This table is very similar to the table shown in the first blog post. However, instead of calculating completion times from the item creation dates, we’ve calculated them from the progress and commit dates.
Next, the dataset is further manipulated to group different items by different story point cohorts and different types of alerts.
Lastly, the dataset is further cleaned and transformed through the removal of outliers and log-transformation of the highly skewed completion time data. This ensures that we are working with data that is normally distributed.
Results
First, let’s take a look at a correlation chart that depicts the relationship between completion time (for issues that did not encounter any alerts) and story point estimates:
Correlation Between Completion Time (in Days) and Story Point Estimates
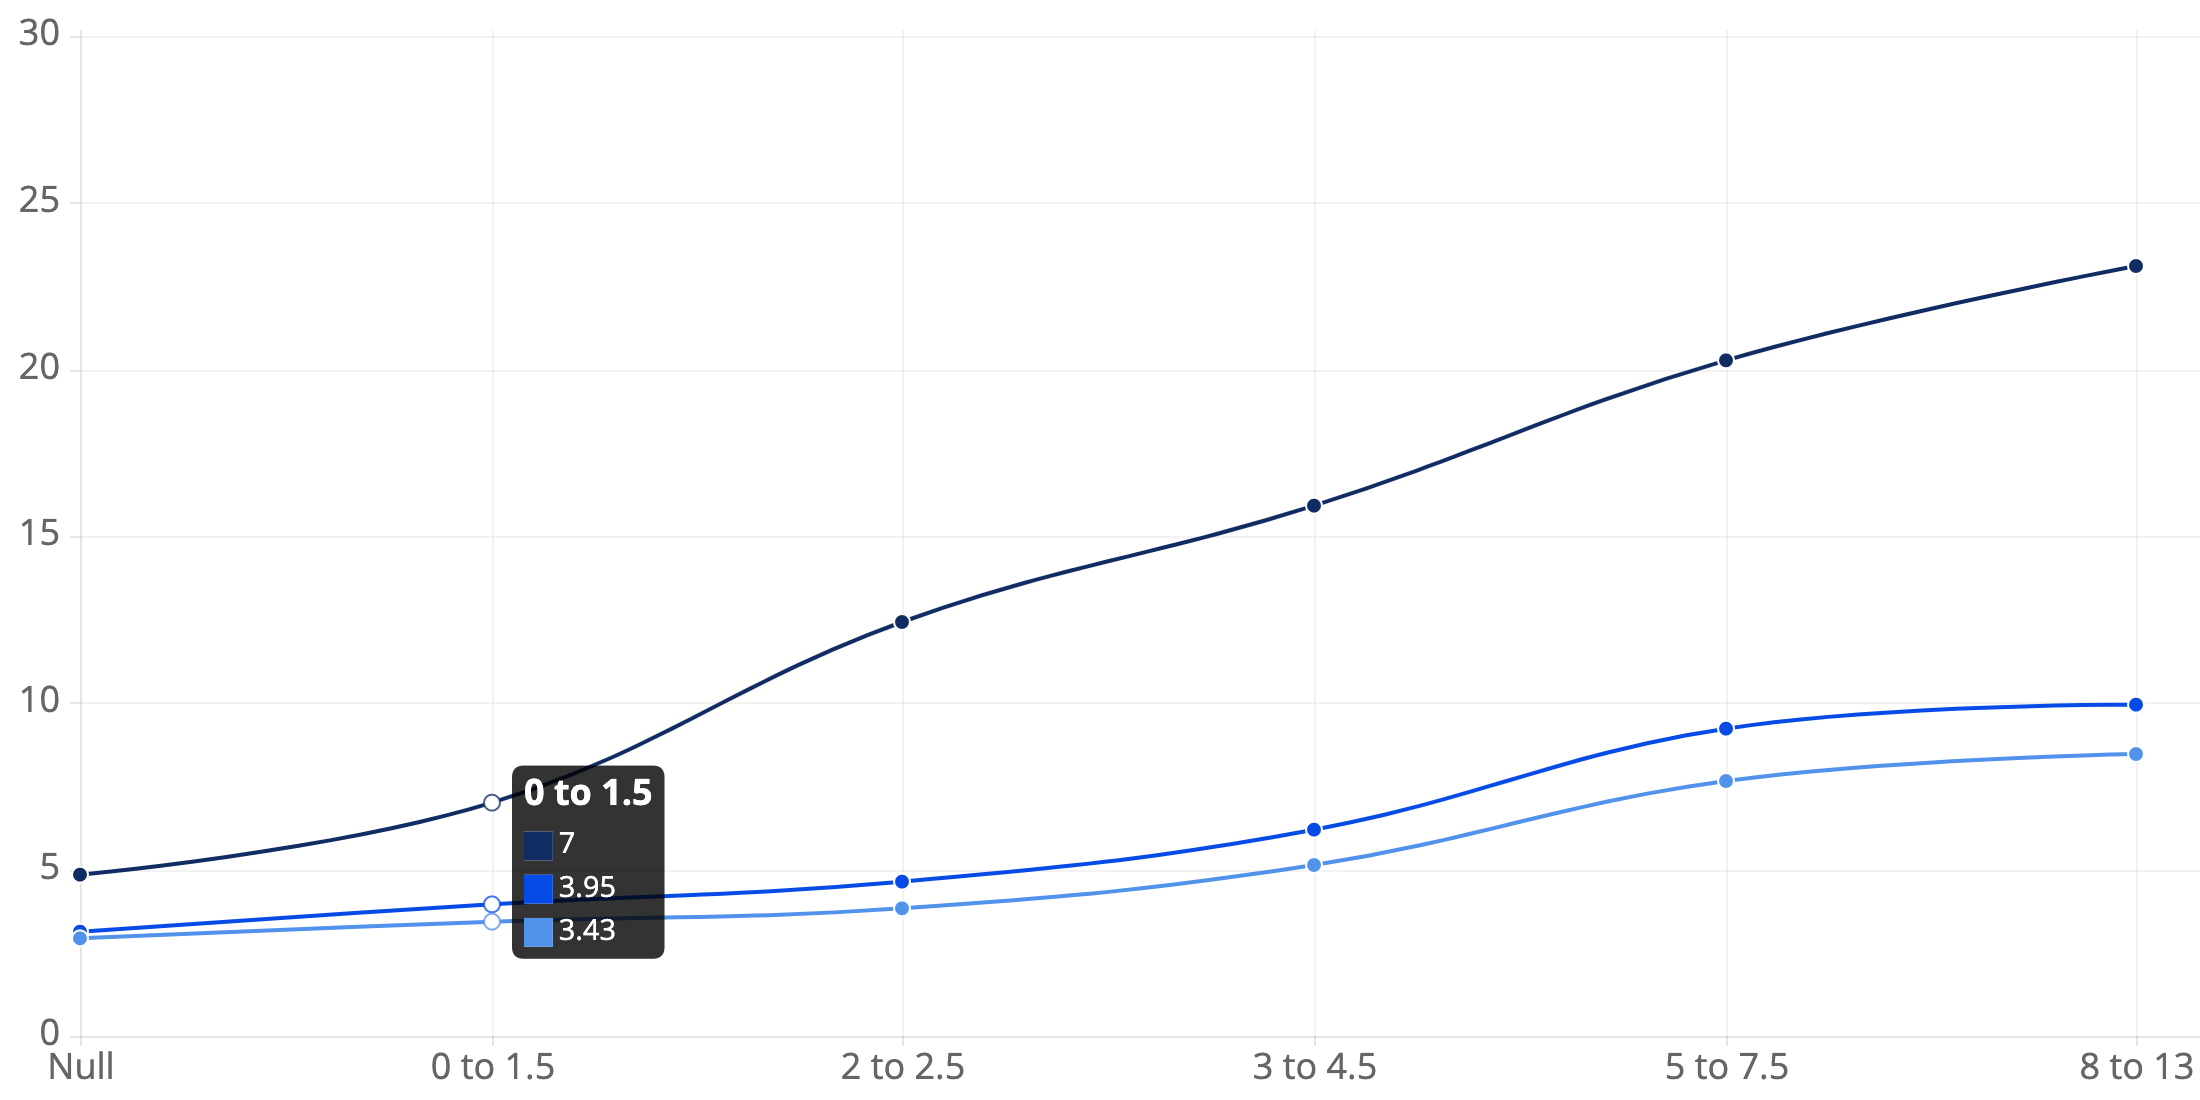
 X-axis represents story point cohorts. Bars represent completion times for issues that did not encounter alerts.
The above chart shows three different lines with the following interpretations:
- For items with story point estimates of 2 to 2.5:
- The median completion time is 12.42 days from the time of creation
- The median completion time is 4.63 days from the time of the first progress state
- The median completion time is 3.83 days from the time of the first commit date
And finally, the chart below depicts the full data of the impact that alerts have on completion times. It can be directly compared to the final chart in the previous blog post, with the difference here being that the start date for items has been updated to the first progress date. To avoid redundancy, the full data based on the first commit date is not shown, as the results are pretty similar.
Median Completion Time (in Days) by Story Point Cohort & Alert Type
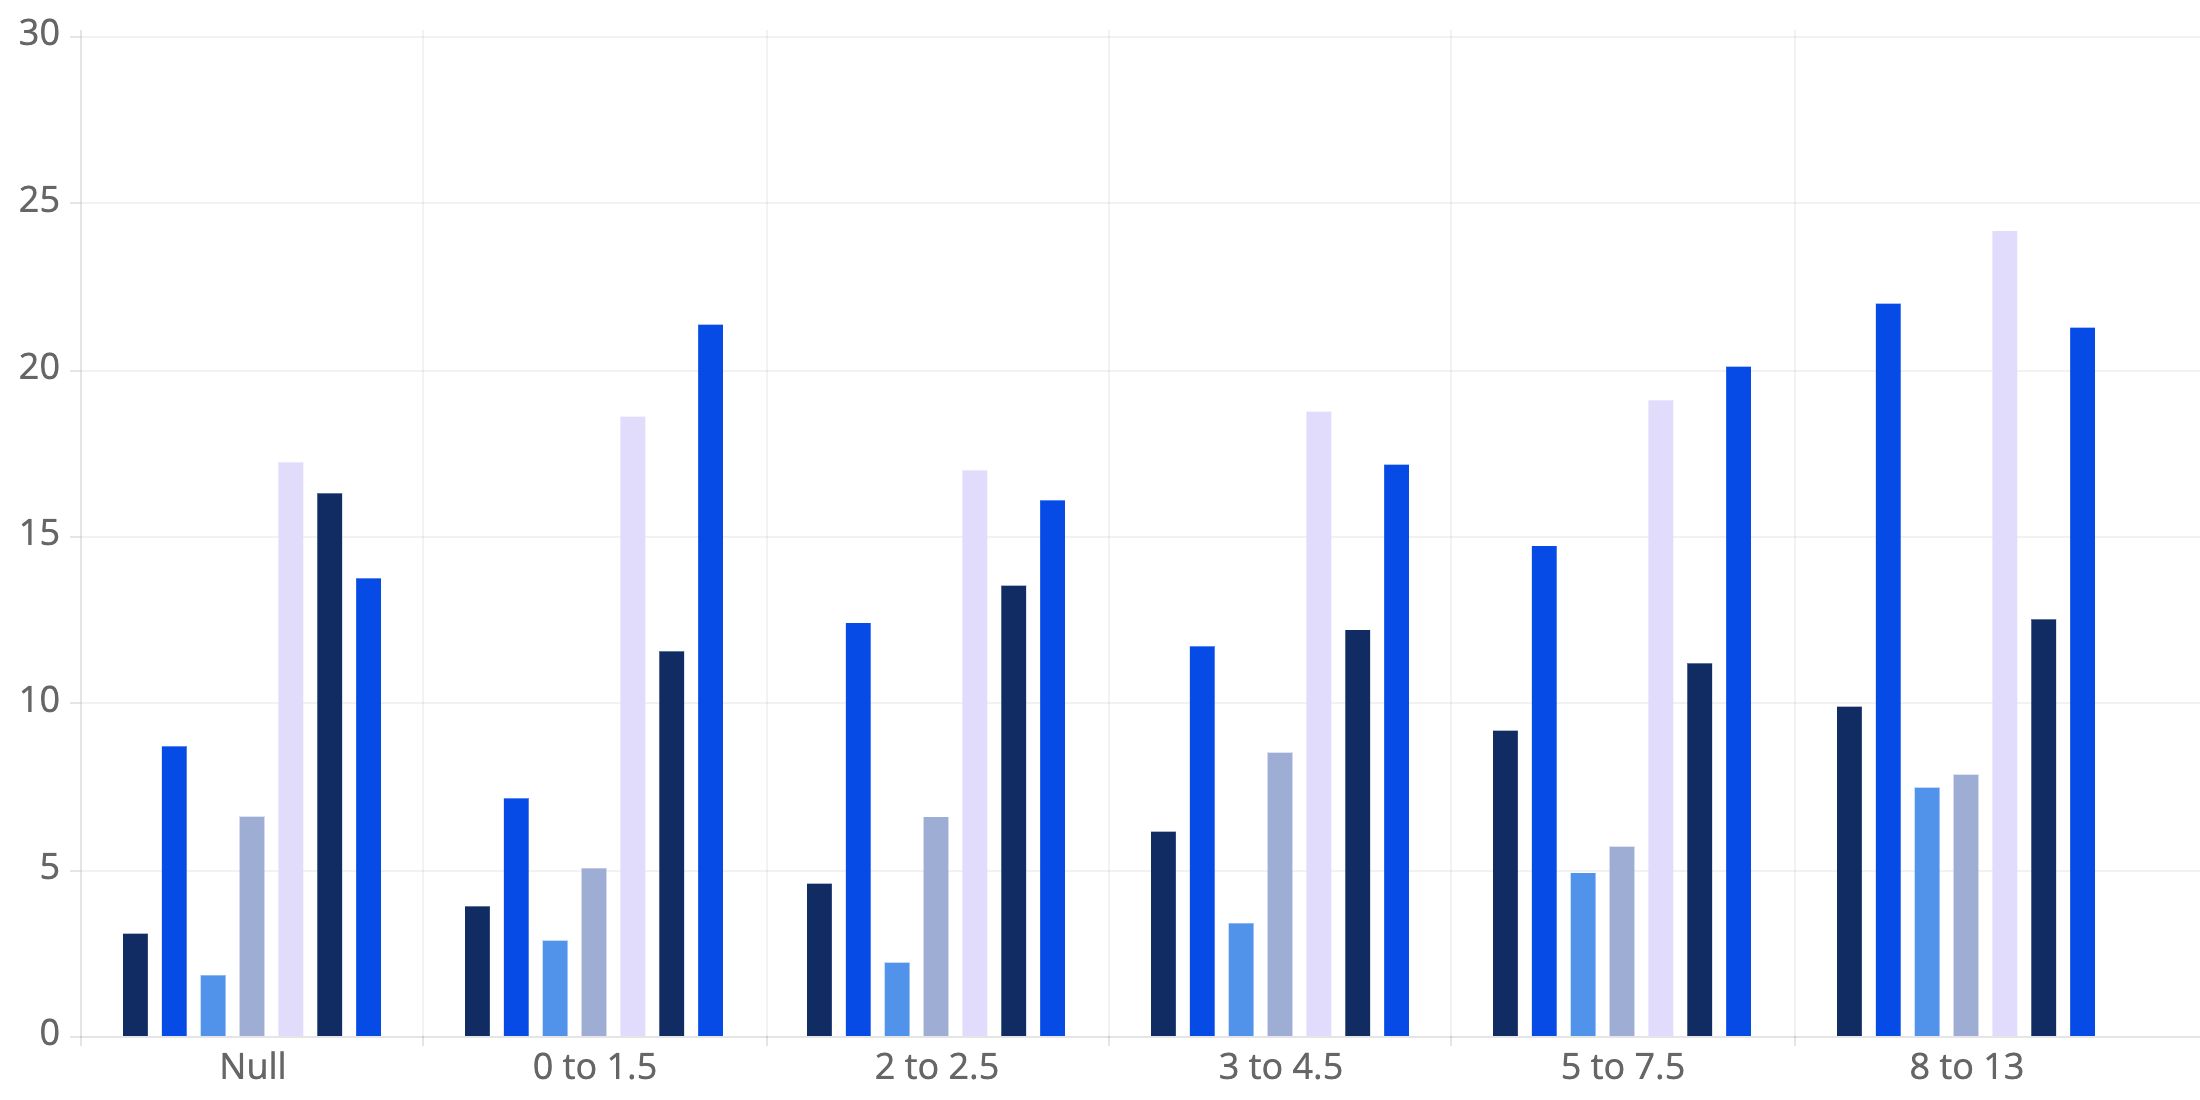

X-axis represents story point cohorts. Bars represent completion times for different types of alerts.
A couple of quick examples of how to interpret the graph are as follows:
- For items with story point estimates of 2 to 2.5:
- The median completion time for items that don’t encounter alerts is 4.63 days
- The median completion time for items with high comment activity is 12.45 days
Conclusion
In short, there are a few key takeaways from these new results:
- Using a more precise start date for items (either the first progress or commit date) leads to drastic improvements in the prediction of software completion
- Allstacks is capable of identifying when an organization’s items are being worked on in real-time and updating software delivery forecasts to be more accurate
- There isn’t a major difference in the completion time results when comparing the use of the first progress date and the first commit date
- However, if a progress date is unavailable, or if a developer forgets to update the status of an active item, then the first commit date can be used
- Additionally, there is enough of a difference to justify identifying when commits occur in real-time and updating software delivery forecasts to be a bit more accurate
- Using a more precise start date also results in improved predictive capabilities for items that encounter alerts
- We’re able to more accurately quantify the relative impact that alerts have on software delivery
However, there’s still more work to be done when it comes to accurately predict software delivery. Stay tuned for the next post, where we’ll explore how Allstacks is using even more sources of data and statistical methodologies to accurately forecast delivery dates for the overall milestones that are being tracked by your organization.
Nonetheless, again, the results presented here are in aggregate. It is important to note that we’ve seen large variations from organization to organization. Our forecasting feature takes into account the fact that different organizations operate differently.
If you are interested in determining how these risks impact your specific team or organization, contact us !