.png)


Strategy & Thought Leadership
High-performing engineering teams deliver what was promised — when it was promised. Forecasting helps leaders minimize surprises and reliably deliver.
/new-Path266.svg)
A team that can minimize surprises and delivers in a repeatable, forecastable way is a team around which you can build a really exceptional organization or company.
However, we know that engineering is not perfect. Bugs appear requirements are unclear, and Bob decided to go to Tahiti for a week. It is difficult to ship new features without understanding the impact of these events on delivery timelines. Engineering teams usually expect a particular level of risk, but this is usually planned for in aggregate by adding 20% to the estimated completion time or simply adding an extra week or two. Even the most agile teams only track attainment percentages over time by looking at how many story points were done in a particular sprint or using average cycle times.
These metrics are a step in the right direction, but the best actions we can take from them are putting up charts and asking questions in a nebulous retrospective meeting. Inevitably, these meetings uncover issues (cards were stuck in Code Review because Bob went to Tahiti, no one knew how to visualize the data on the report page, etc.) after it is too late.
Ultimately, these risks are the cause of velocity drifting down and cycle time drifting up. And they are only heard about when reported, and very likely when it is too late to act on them. At Allstacks, we believe that these risks are the most significant drivers in software development cycle delays (see data below). Acting upon them as soon as possible dramatically reduces their negative impact.
Many engineering teams are building software without the appropriate data necessary to identify risks and direct decision-making. Allstacks was built to help organizations identify and address these discrete risks in the software delivery process. Our predictive analytics determine if a product is at risk of being delivered late (by looking at these individual risks), forecast a risk-adjusted completion time, and provide actionable recommendations to meet your team’s commitments.
So, how do Allstacks forecast risk-adjusted completion times for software delivery? This is part one of a four-part blog series that explores how we’re using data to estimate the impact of various different issues that come up in software development.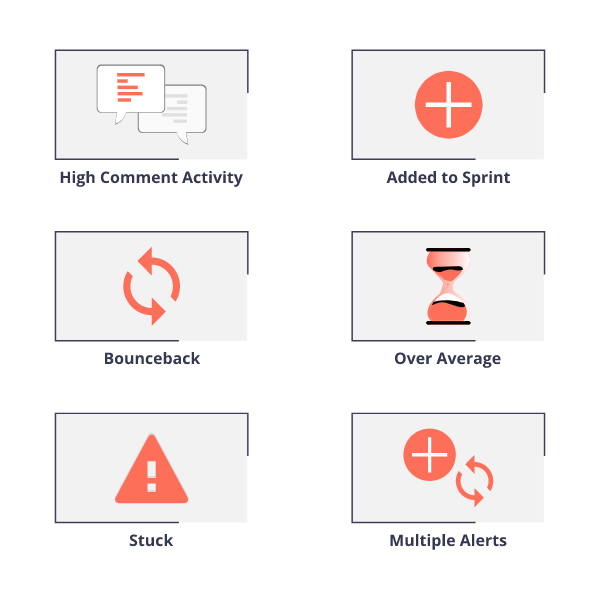

Organizations face countless problems in the software development process. Currently, Allstacks focuses on a specific set of issues that threaten the timely delivery of software. In this series, we’ll analyze and discuss five of the most impactful issues: high comment activity, late additions, bouncebacks, over-average items, and stuck items. At Allstacks, we formally define these problems as follows:
- High Comment Activity - alert for issues that have significantly more discussion activity than the determined baseline for issues in your organization
- Late Additions - alert for issues that are added to a sprint after work has already begun
- Bouncebacks - alert for issues that move backward in the primary issue flow
- Over Average - alert for issues that are open longer than the Average for issues of that type
- Stuck - alert for issues that are in a stage significantly longer than other issues of that size and type
- Multiple Issues - alert for issues that have 2 or more of the above alerts or other alerts we generate that aren’t discussed in this post
When these problems occur, we provide real-time alerts about them to help organizations mitigate risk. In this first post, we’ll establish baseline estimates of these alerts’ impact on item completion. Future posts will demonstrate how we improve upon the accuracy of these baseline measurements by using additional sources of data.
Data Introduction
Before estimating the impact of these alerts, we’ll provide a bit of context about the data we have on the alerts that we generate.
The following chart depicts the distribution that we’ve seen thus far for these alerts:
Alert Count by Story Point Cohort & Alert Type
- High Comment Activity
- Added to Sprint
- Bouncebacks
- Over Average
- Stuck
- Multiple Issues
Note that the count of alerts is heavily skewed towards issues with lower story point estimates. Obviously, this is because most issues in a development cycle will have low story point estimates, and therefore the alerts that we generate should follow that distribution. However, you’d expect the distribution to be a bit less skewed than shown above. In theory, common story point issues should be “easier” and therefore encounter fewer problems. The data we’ve collected thus far indicates that is not the case, which highlights that one problem with a high 13 story point issue is likely going to be less impactful than multiple problems with a few of your lower story point issues.
Additionally, the following chart depicts the correlation between completion time (for issues that did not encounter any alerts) and story point estimates:
Correlation Between Completion Time (in Days) and Story Point Estimates
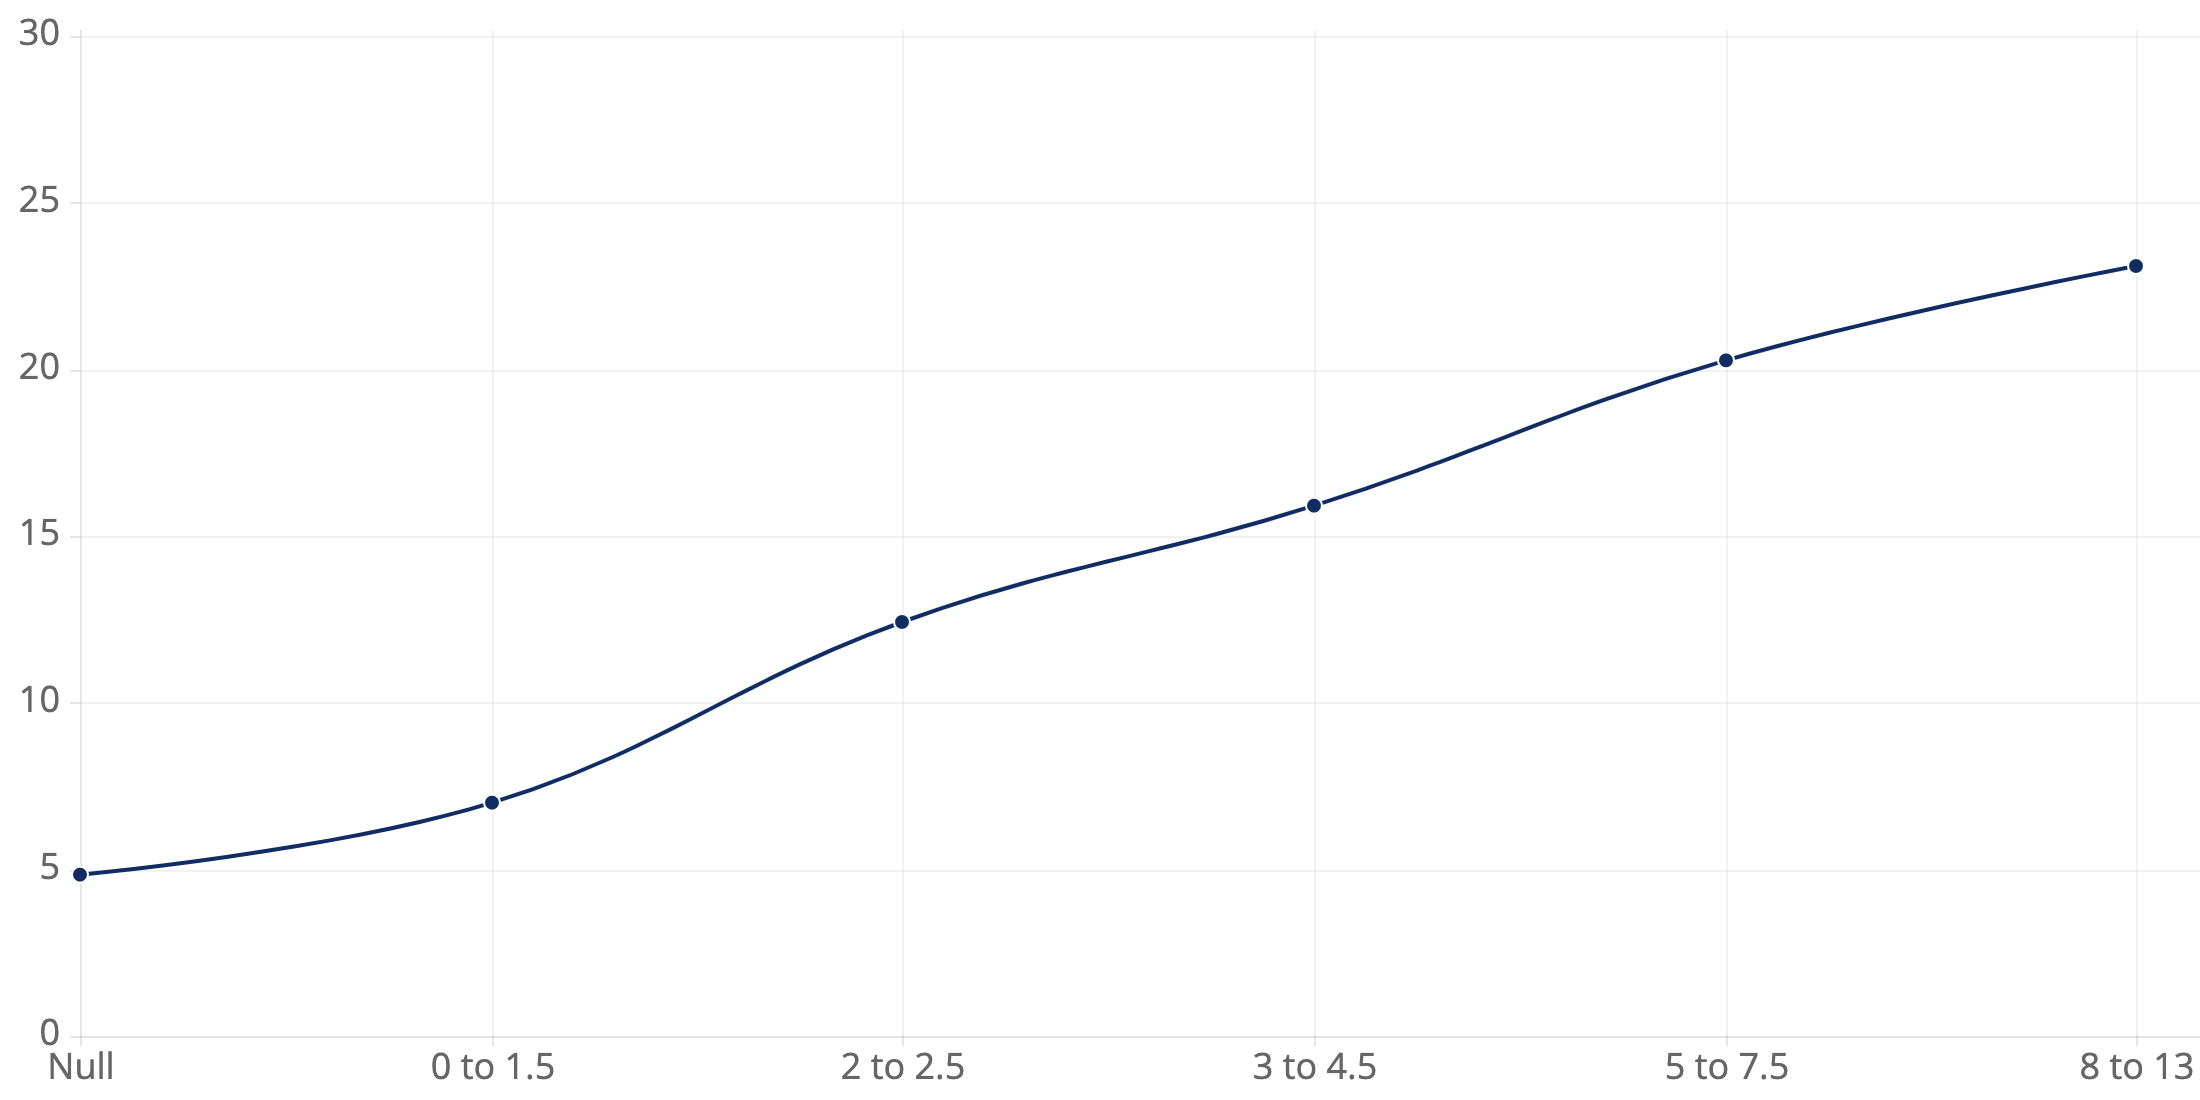

The X-axis represents story point cohorts. Bars represent completion times for issues that did not encounter alerts.
We show this correlation chart because agile purist will argue that story point estimates do not correlate to time. This logic is flawed, and the data we’ve collected indicates that there definitely is a correlation. The more complex that an issue is, the longer it should take to complete. Teams see this bear out in planning when looking at past velocity to predict how many story points can be completed in a specific time frame. While there isn’t a magic conversion (1 story point is equivalent to 1 day), teams establish a pattern of predictability used for planning, which ultimately results in a crude measure of time from story points.
Therefore, the fact that there definitely is a correlation between story points and completion time lends further credibility to the forecasted risk-adjusted completion times that Allstacks ultimately provides to engineering teams.
Now that some context has been established, the following couple of sections will show baseline estimates for the impacts that different alerts have on completion times, ultimately driving our risk-adjusted forecasts.
Data Process
To begin establishing baseline results, we pull together a dataset that looks something like the following table:
| Item | Story Points | Creation Date | Completion Date | Completion Time | Alert Type |
|---|---|---|---|---|---|
| 1 | 3.0 | 4/4/2019 21:22:25 | 4/11/2019 14:41:32 | 6.708 Days | Added to Sprint |
| 2 | 1.0 | ... | ... | ... | |
| 3 | 0.5 | ... | ... | ... | |
| 4 | null | ... | ... | ... | |
| 5 | null | ... | ... | ... | |
| 6 | 2.0 | ... | ... | ... | Bounceback |
| 7 | 1.0 | ... | ... | ... | |
| 8 | 3.0 | ... | ... | ... | |
| 9 | 5.0 | ... | ... | ... | High Comments |
| 9 | 5.0 | ... | ... | ... | Bounceback |
| 10 | 1.0 | ... | ... | ... |
The blue fields (items, story point estimates, creation date, completion date, completion time) indicate data that Allstacks collects from Jira. The orange area (alert type) is powered by Allstacks algorithms that automatically flag items as having encountered one of the problems discussed in the introduction.
Note that there are “null” story point estimates. This is due to a variety of different reasons:
- Some teams don’t point stories at all
- Some teams point stories but don’t point bugs
- Some teams point stories, bugs, and tasks, but don’t point sub-tasks
- Some teams only point a subset of stories
- Some teams are in the process of adopting story points and haven’t 100% moved over yet
Next, the dataset is further manipulated to differently group items by different story point cohorts and different types of alerts. Additionally, items associated with multiple alerts (such as item 9 in the above table) are simply indicated as having multiple alerts. This ensures that items with multiple alerts aren’t grouped with items that only have one alert, which ultimately helps single out the impact of each type of alert on the completion time.
Lastly, the dataset is further cleaned and transformed by removing outliers and log-transformation of the highly skewed completion time data. This ensures that we are working with data that is normally distributed.
Results
Statistical significance testing is conducted to quantify the impact of alerts on completion time. The completion times for items with no alerts are treated as the base point of comparison. The baseline results are depicted in the following graph:
Median Completion Time (in Days) by Story Point Cohort & Alert Type
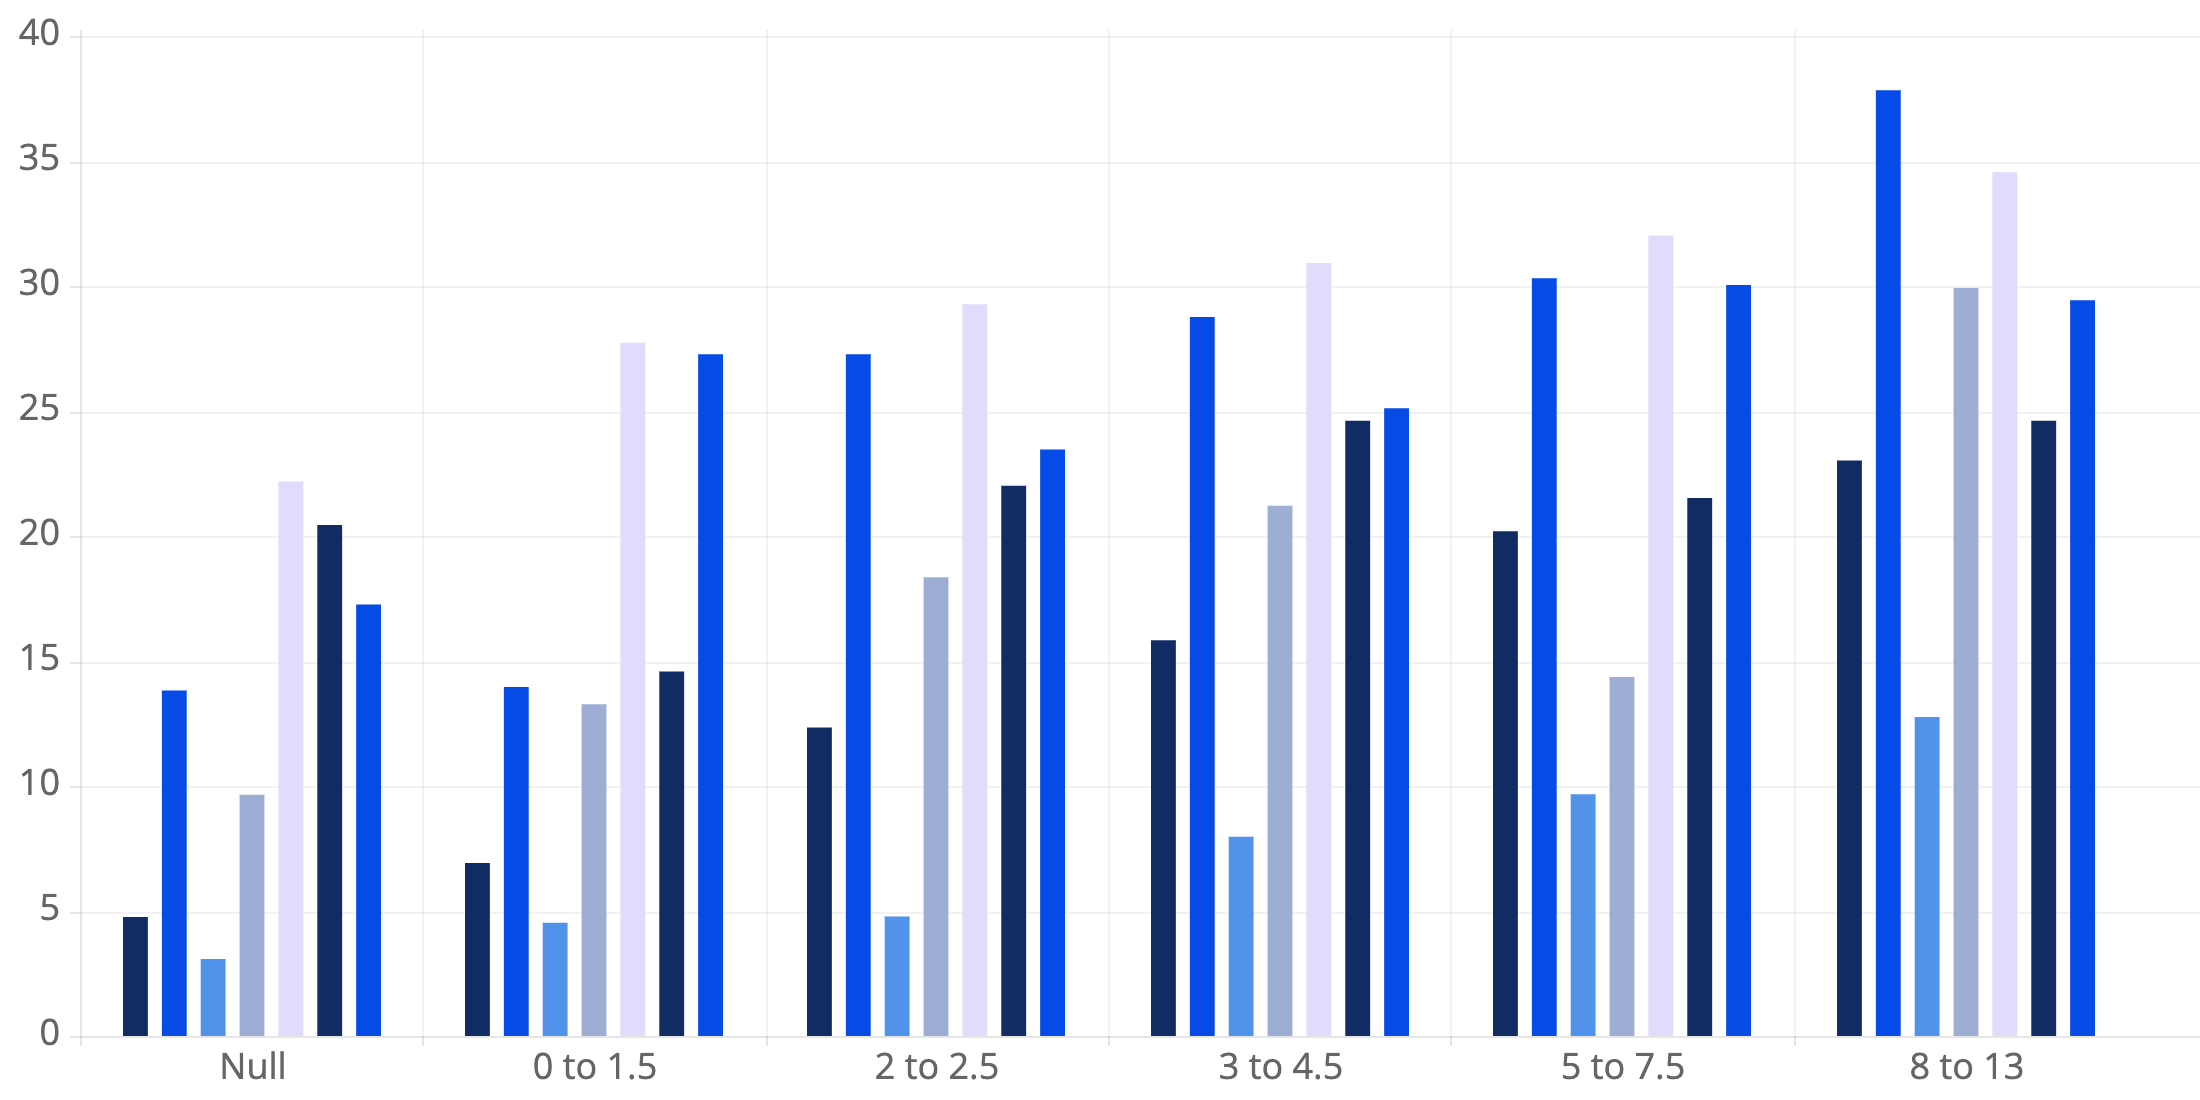

The X-axis represents story point cohorts. Bars represent completion times for different types of alerts.
A couple of quick examples of how to interpret the graph:
- For items with story point estimates of 2 to 2.5:
- The median completion time for items that don’t encounter alerts is 12.42 days.
- The median completion time for items with high comment activity is 27.35 days.
Takeaways
In short, there are a few key takeaways from the baseline results:
- In general, items that encounter alerts take a longer time to complete than items that don’t. The exception here is added items to a sprint late, which seem to be completed a bit quicker.
- The presence of multiple alerts further delays the item completion time.
- The most significant percentage difference between non-alert and alert items is in the “null” story point cohort.
- Items without alerts are completed very quickly.
- Items that encounter alerts are delayed very significantly.
However, these results establish baseline performance. In the next few posts in this series, we’ll explore how Allstacks uses additional data sources to develop more accurate completion times for different items and completion time differences between non-alert and alert items.
Nonetheless, it’s important to point out that all of the data presented here and in future posts is aggregate data. If you are interested in determining how these risks impact your specific team or organization, contact us at Allstacks!