Our roadmap: Leveling up Engineering in the Board Room — Allstacks
A look at Allstacks strategic roadmap initiatives that will empower engineering organizations to become equal players in the boardroom.
For our Q2 roadmap, we are delivering on some strategic initiatives that will make some significant progress to this goal.
Engineering as an equal player in the boardroom.
Every company is now a software company (at least, if you read their 10-k or the analyst news.) That means the business's success starts with engineering's ability to deliver the roadmap without surprises or slipped deadlines. Until now, there wasn't an easy or consistent way to talk about how engineering is doing with other product stakeholders like executives, sales, customers, and the board. It's hard to get an accurate picture of how work is progressing and what is getting in the way. The result is a reactive response to business outcomes when instead, we should be proactively creating and managing engineering outcomes that align with the business's needs.
Transparency, accountability, and continuous improvement are characteristics all departments should strive for and have the tech to operationalize. Just as sales and marketing have CRM solutions and finance has ERP tools, engineering should show how well they operate, what they contribute to the business, and where and how they can improve.
What we're building will double down on the work we have already done to help improve engineering's visibility into their work while giving the rest of the business a framework for understanding success.
What we are building in Q2.
Portfolio Timeline View
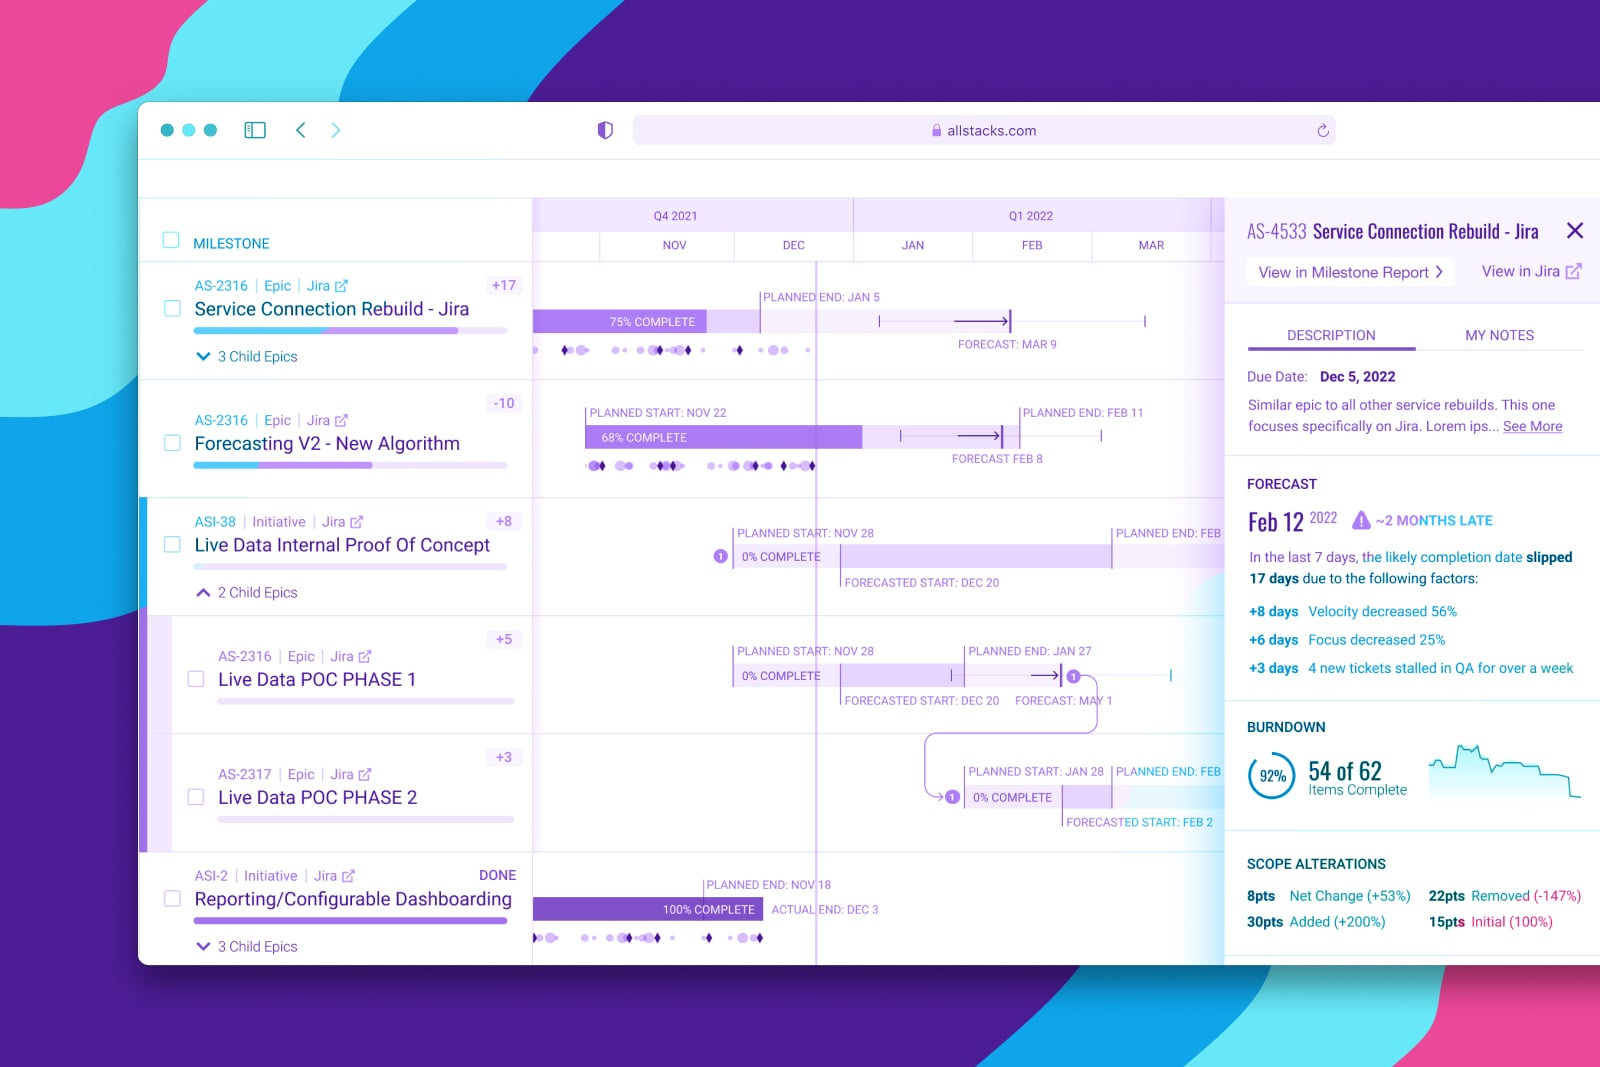
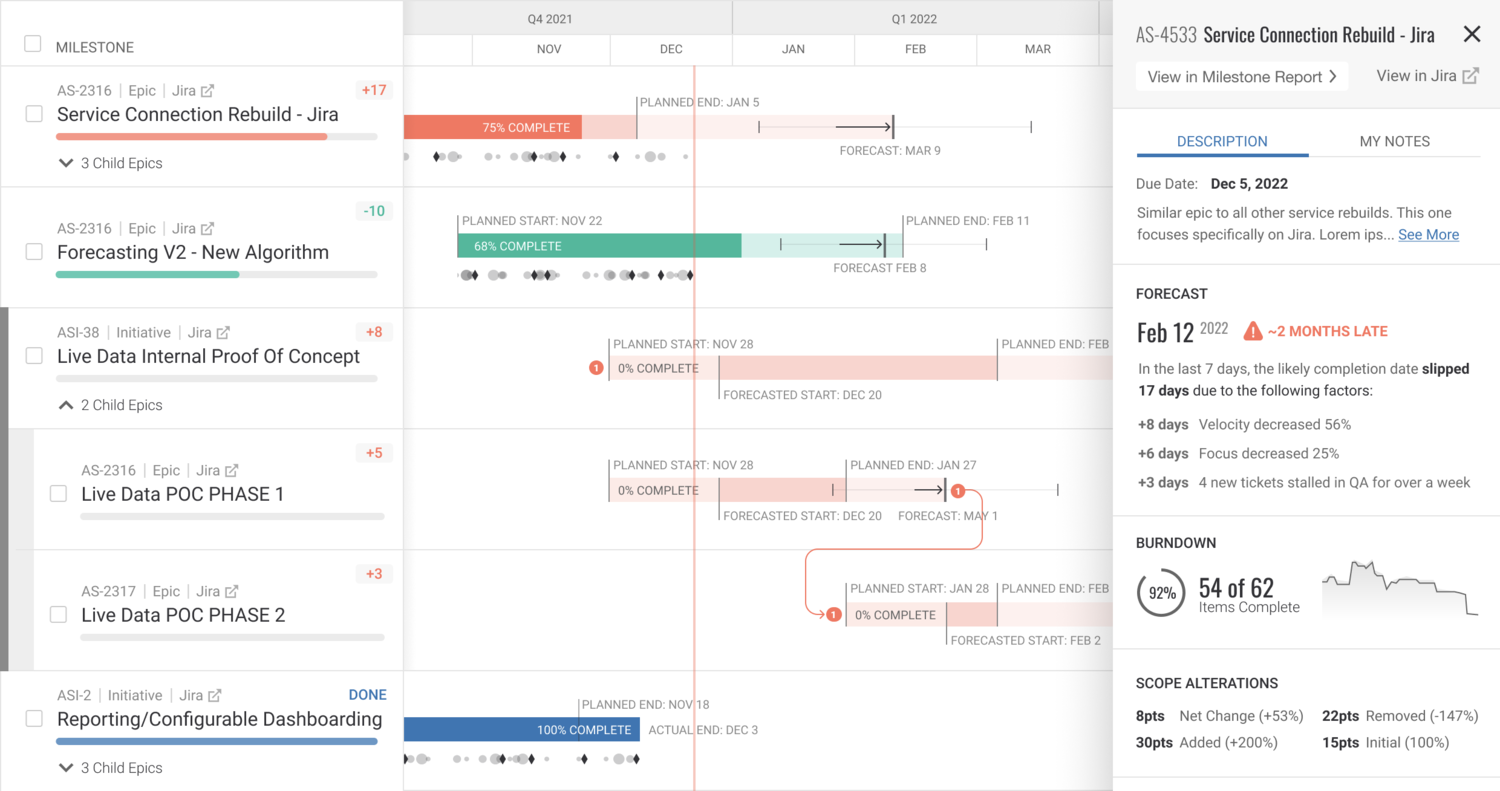
A timeline view of the Portfolio Report has been a highly-requested improvement to Allstacks. It includes a visualization that everyone from project managers to CEOs understands — a Gantt chart. Along with introducing a Gantt chart, the Timeline will also have all of the things our customers love about Allstacks, including activity indicators, % complete but with plan and forecast which will help teams understand if they are trending better or worse.
This visualization of the Portfolio Report will enable product stakeholders, engineering leaders, and managers to get aligned on priorities and have more contextual conversations about projects, dependencies, resources, and timelines before there is a surprise.
The Timeline View will be the most comprehensive way a software leader can view a series of complex, linked, and dependent deliverables in a forward-looking manner. Leaders will quickly understand what projects are going as planned and what’s going sideways with this context and visibility — with enough lead time to actually course correct.
Below is an early design concept that captures the functionality we are looking to build for the timeline view of the Portfolio Report:
Enhanced Executive Dashboards
To date, our reports and metrics have been focused on providing engineering leaders visibility into how things are going so they can get early indicators of when work is slipping and where the team needs to be unblocked or processes improved. Over the last couple of quarters, we introduced aggregation capabilities that allowed for broader, org-wide reporting — a key request from our customer base.
In a recent release, we made it easy to group data in charts by tags so that the work of hundreds of developers can be viewed by pods, divisions, geographic locations, or whatever groupings you want to create (e.g. Junior front-end devs hired in the 1st month of covid). Soon, you’ll also be able to group by the teams you’ve set up in Allstacks. With the ability to intelligently group the data, you can quickly create impactful executive-level dashboards. From these aggregated views, you can click through to the specific metric detail to tease apart the groups, and investigate why one group may be struggling where another is doing well.
Additionally, we’re working on adding new metrics specifically designed for executive leadership. Here are some examples:
Epic Velocity will show you the new features released to customers over a specific period and whether that delivery rate is trending up or down. Additionally, this view of velocity will be accessible beyond epics, including initiatives, labels, releases, etc.
Commitment Accuracy will show you the gaps between the target dates set on your milestones and when they were actually delivered, plus whether that gap is trending wider or getting tighter over time.
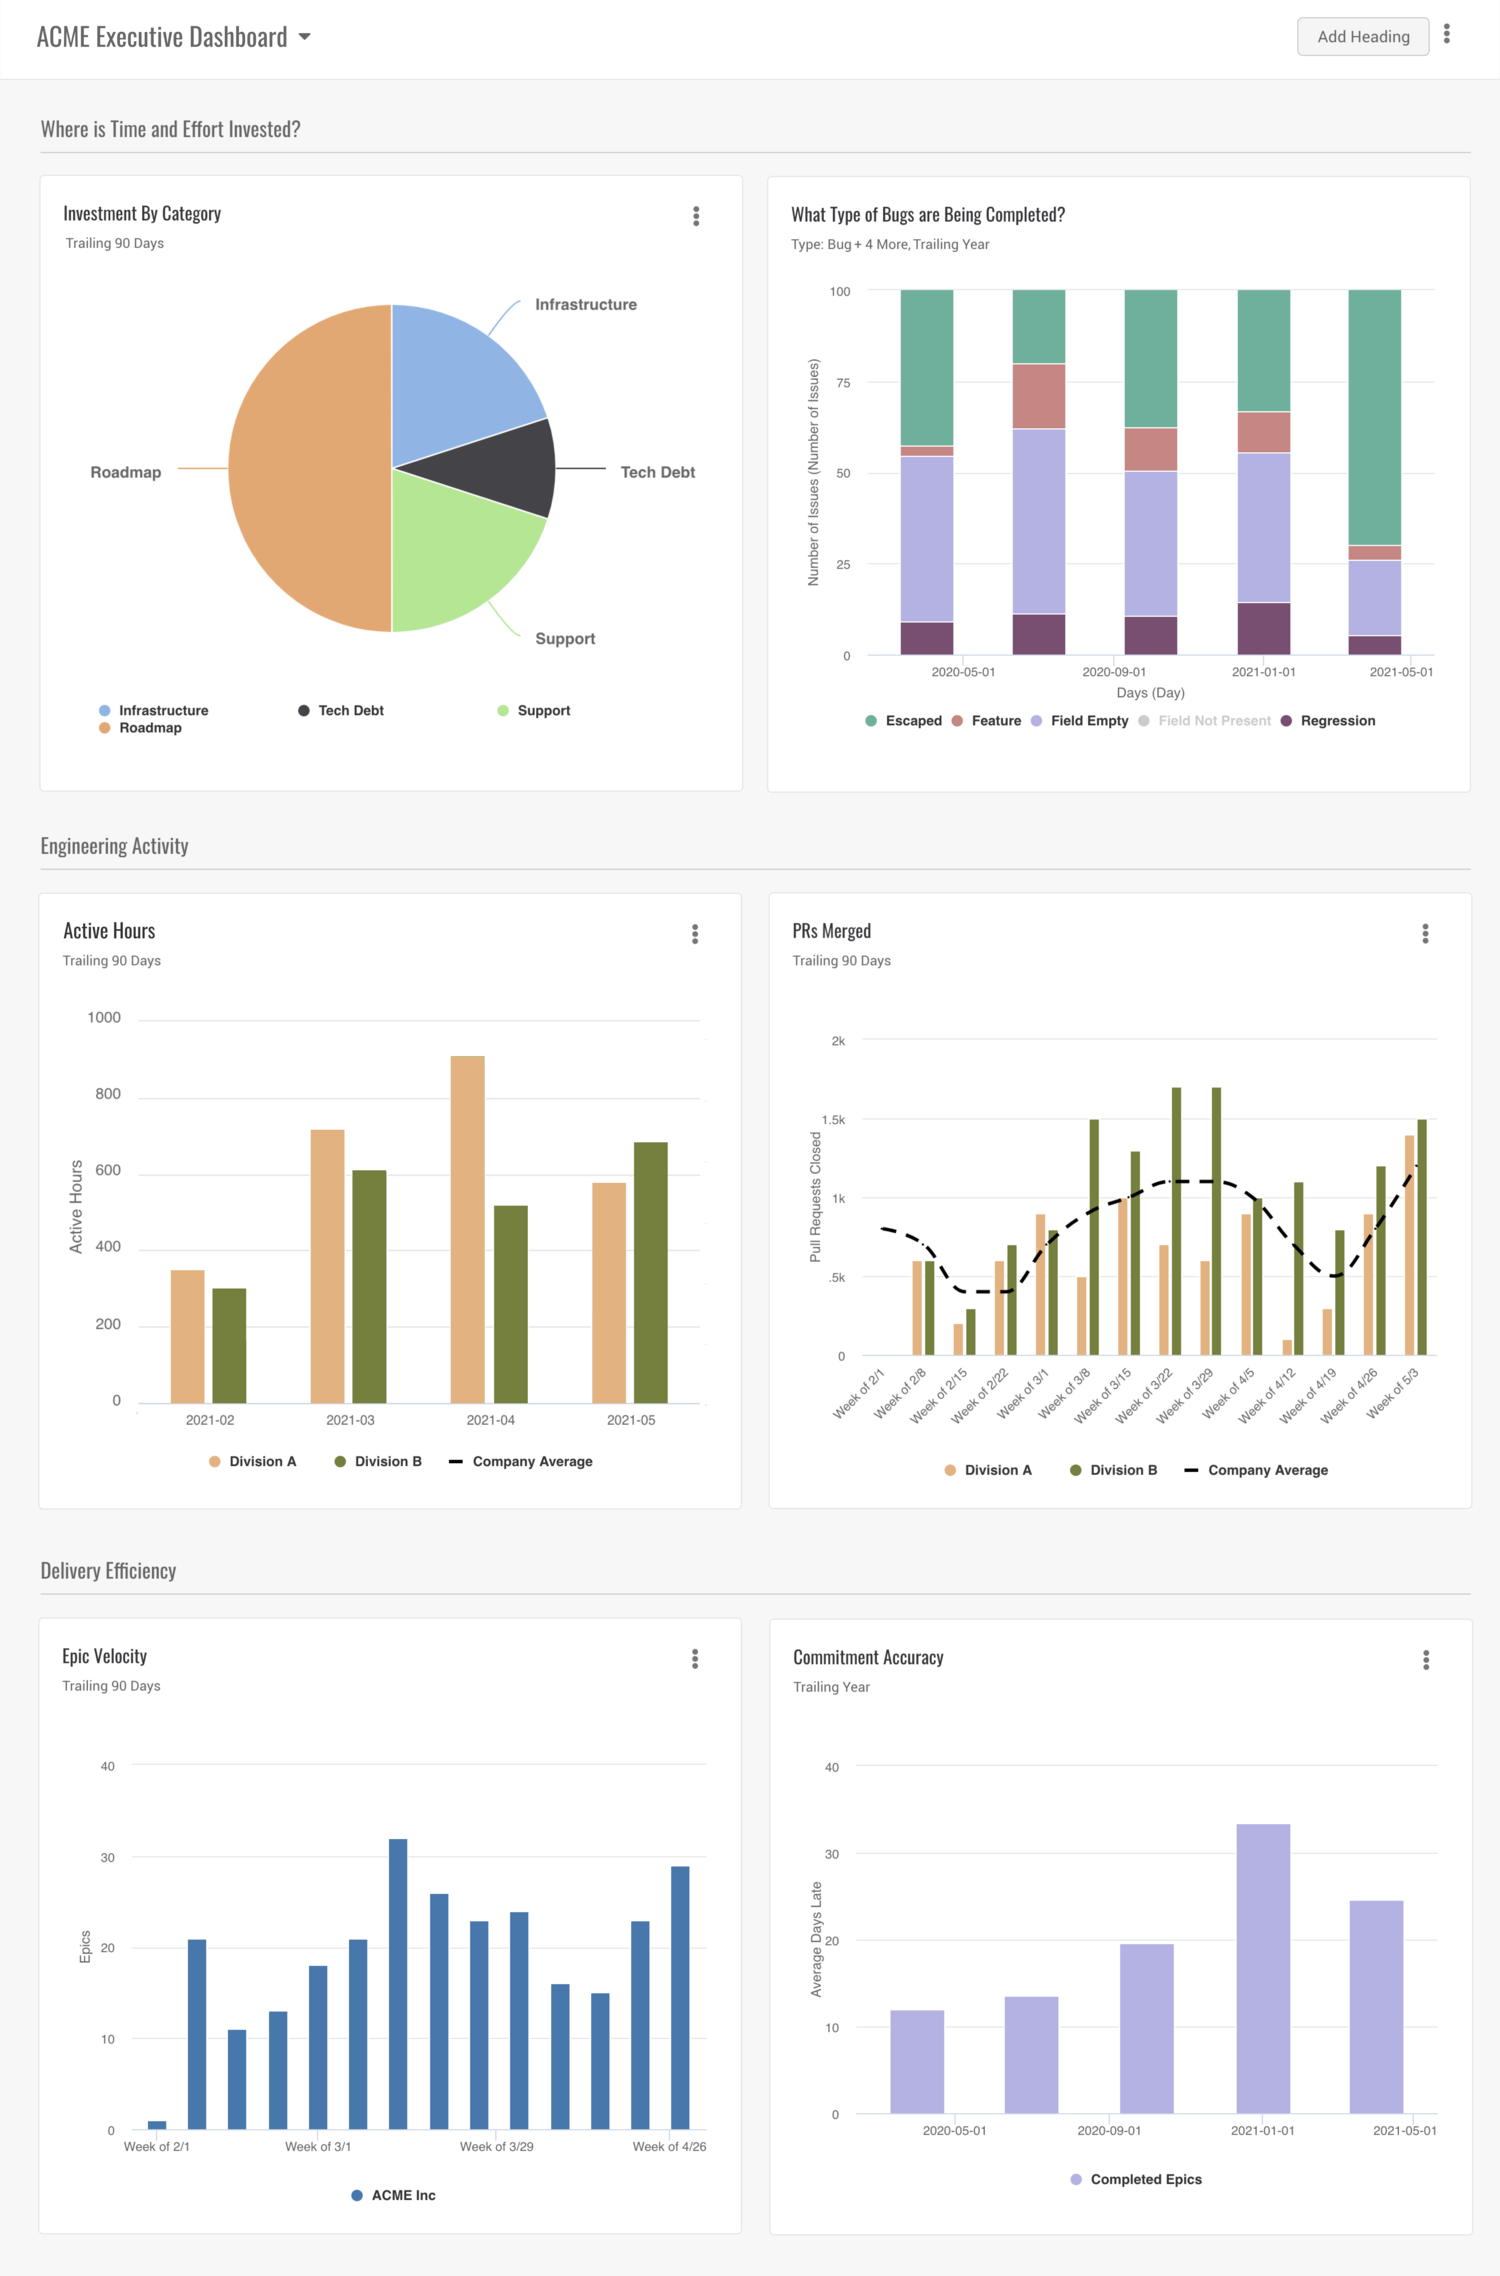
These metrics will give leadership insight into whether their organization’s capacity to deliver value to customers is trending in a positive direction or needs additional investment to improve.
Data Table Enhancements
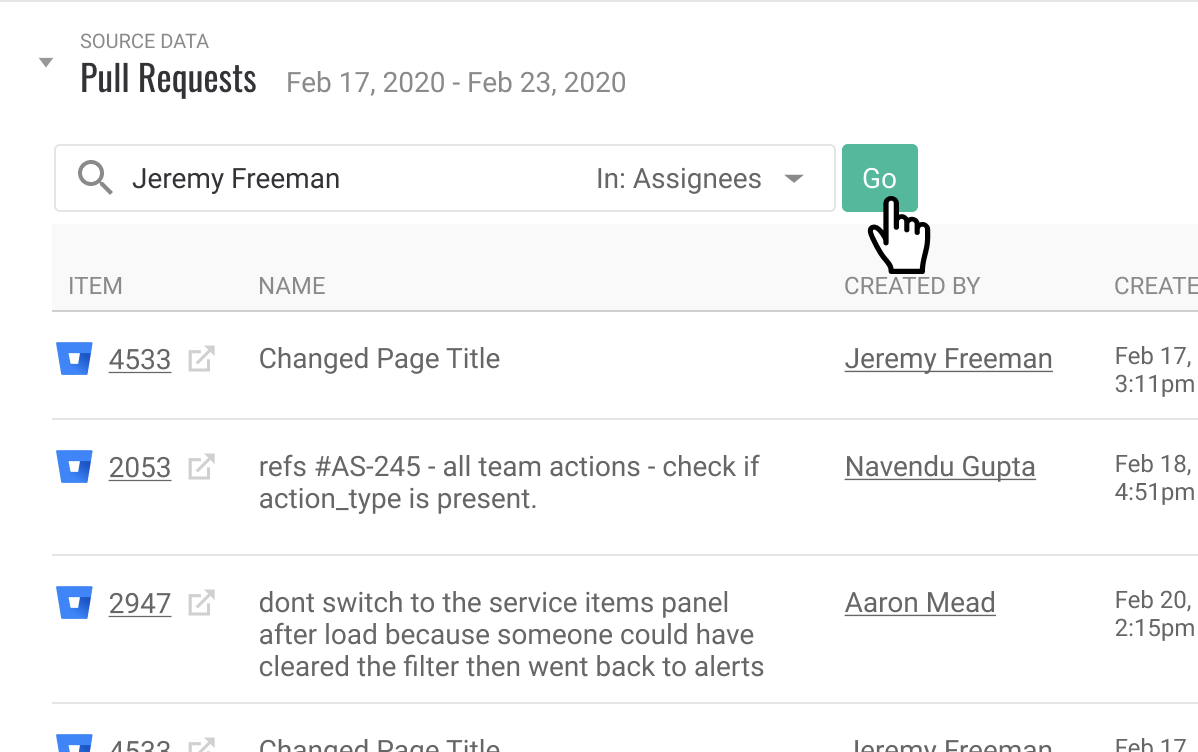
Allstacks already provides metrics for customers to track their software delivery performance across code, builds, workflow, and even team sentiment. Often, a customer will want to investigate further to verify our calculation and better understand the underlying activities driving the metric to resolve outlier metrics like problematic cards, PRs, etc. Today, finding the outliers of interest in the source data tables, especially when there are thousands of data points, can be a bit awkward.
We are making significant improvements to our data tables to improve usability and allow for more robust access to the metric source data with configurable views, charts, search, and filtering. There will also be a CSV export for those who want to do more custom reporting off the data we aggregate.
Forecasting, Forecasting, Forecasting!
At our core, we are a forecasting company. ‘Investing in our algorithms’ is a theme you can expect to be on our roadmap in perpetuity. We are currently working on some behind-the-scenes architecture projects that will enable our models to become more powerful. To tease a couple of topics we’re investing in heavily, all of which are aligned with customer requests:
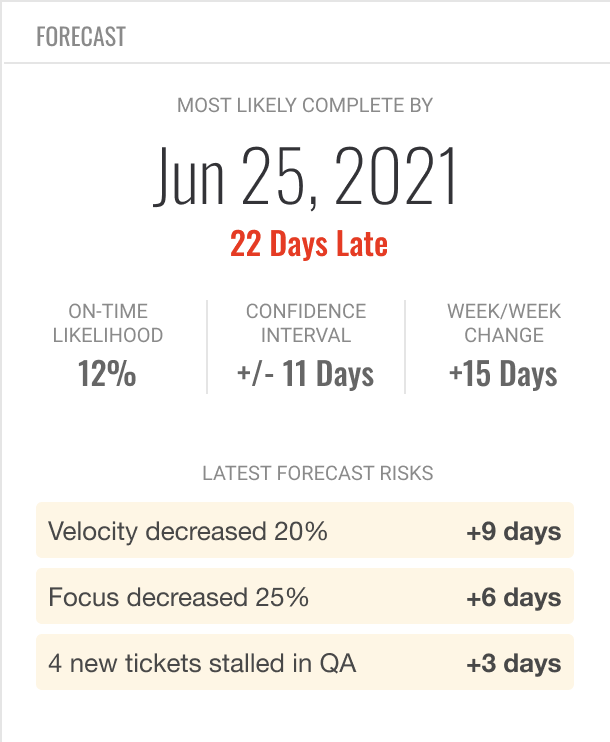
Introducing explainability of forecast changes
Improvements to feasibility analysis by forecasting every independent stage in your process that rolls up to the initiative’s forecast date.
You can look forward to much more content, improvements, and features around our forecasting capabilities with each release.
If you are interested in seeing Allstacks in action with your own data or getting more detail on our roadmap, schedule some time with us.
Here are some additional resources you should check out:
Table of contents


/ get started /
