.png)


Strategy & Thought Leadership
We're rolling out new features that allow for greater personalization specific to each user’s role in the org and making it easier to standardize reports.

We want to put reliable, predictive intelligence in technology leaders’ hands in order to foster trust between teams, give engineering a strategic voice in the boardroom, and deliver software with confidence.
We’ve already unlocked a level of visibility for engineering teams like they’ve never had before, enabling them to take a more active role in planning strategic business outcomes. To deliver on the promise of connecting engineering to the rest of the business, we need to extend the insights available to all product stakeholders so they are all consistently looking at the same data but in their own context to improve collaboration around software delivery.
This quarter we are rolling out a number of new features that allow for greater personalization specific to each user’s role in the organization while also making it easier to standardize and structure reports across the app for their teams.
Click to jump to specific roadmap items:
- New capabilities to power personalized reporting
- Expanded data sets for higher-level reporting
- Executive-level Metrics & Dashboards
- Enhanced Forecasting algorithm and explanations
- Current engineering focus and activity visualized on the Portfolio Report
- More UI enhancements!
Personalized reporting powered by advanced filters & dashboard templates
What a particular stakeholder cares about can vary significantly based on org size, function, etc. For example, where Engineering needs a holistic view of things like PR Cycle Time and Commit Activity, their counterparts may not. While Customer Success may be primarily concerned with high severity escaped defects, Product may only want to focus on roadmap progress. The following items will be introduced to support further personalization:
- Advanced filtering capabilities will deliver granular control over your data and also expand the value of Allstacks beyond just engineering to other product stakeholders as well. By giving users detailed control and customization of Allstacks’ out-of-the-box dashboards, reports, and metrics based on their role or specific KPIs users can now create visualizations specific to interactions between stakeholders.
- Clone entire dashboards. Once users have leveraged advanced filtering to create the operating model they desire, they can leverage these templates across the organization to create standard operating models consistent across the rest of the organization.
Providing insights tailored to the user's context will improve reporting consistency, collaboration, and alignment with other stakeholders by ensuring the team is basing decisions on the same data.
Expanded data sets to connect Engineering outputs to business outcomes
Along with the ability to tailor how users want to view their data in Allstacks, we’re also expanding the types of data we can ingest and analyze beyond engineering-specific reporting to connect their efforts to:
- Higher-Level Business Initiatives
- OKRs
- R&D Capitalization
- Thematic Investment Categories
- And more — whatever card types your team uses to group work will be available for reporting and forecasting.
To accomplish this, we’re changing how we structure and map existing data. This will allow for more flexibility and custom grouping of organizations' data that unlocks these higher-level insights and extends the value of Allstacks to other product stakeholders without new integrations.
Executive Dashboards to better represent Engineering in the boardroom
For engineering to be better represented in the boardroom, they need meaningful, reliable, and consistent information about how engineering activity impacts business outcomes. Until now, leaders have either been unable to report at this level or spend a lot of time pulling this data together only to create more questions than answers.
To do this effectively, Software leaders need insights into how the entire organization is doing against key initiatives to make strategic investment decisions. We’ve spent some time rethinking how to effectively convey the value Engineering is delivering in the boardroom.
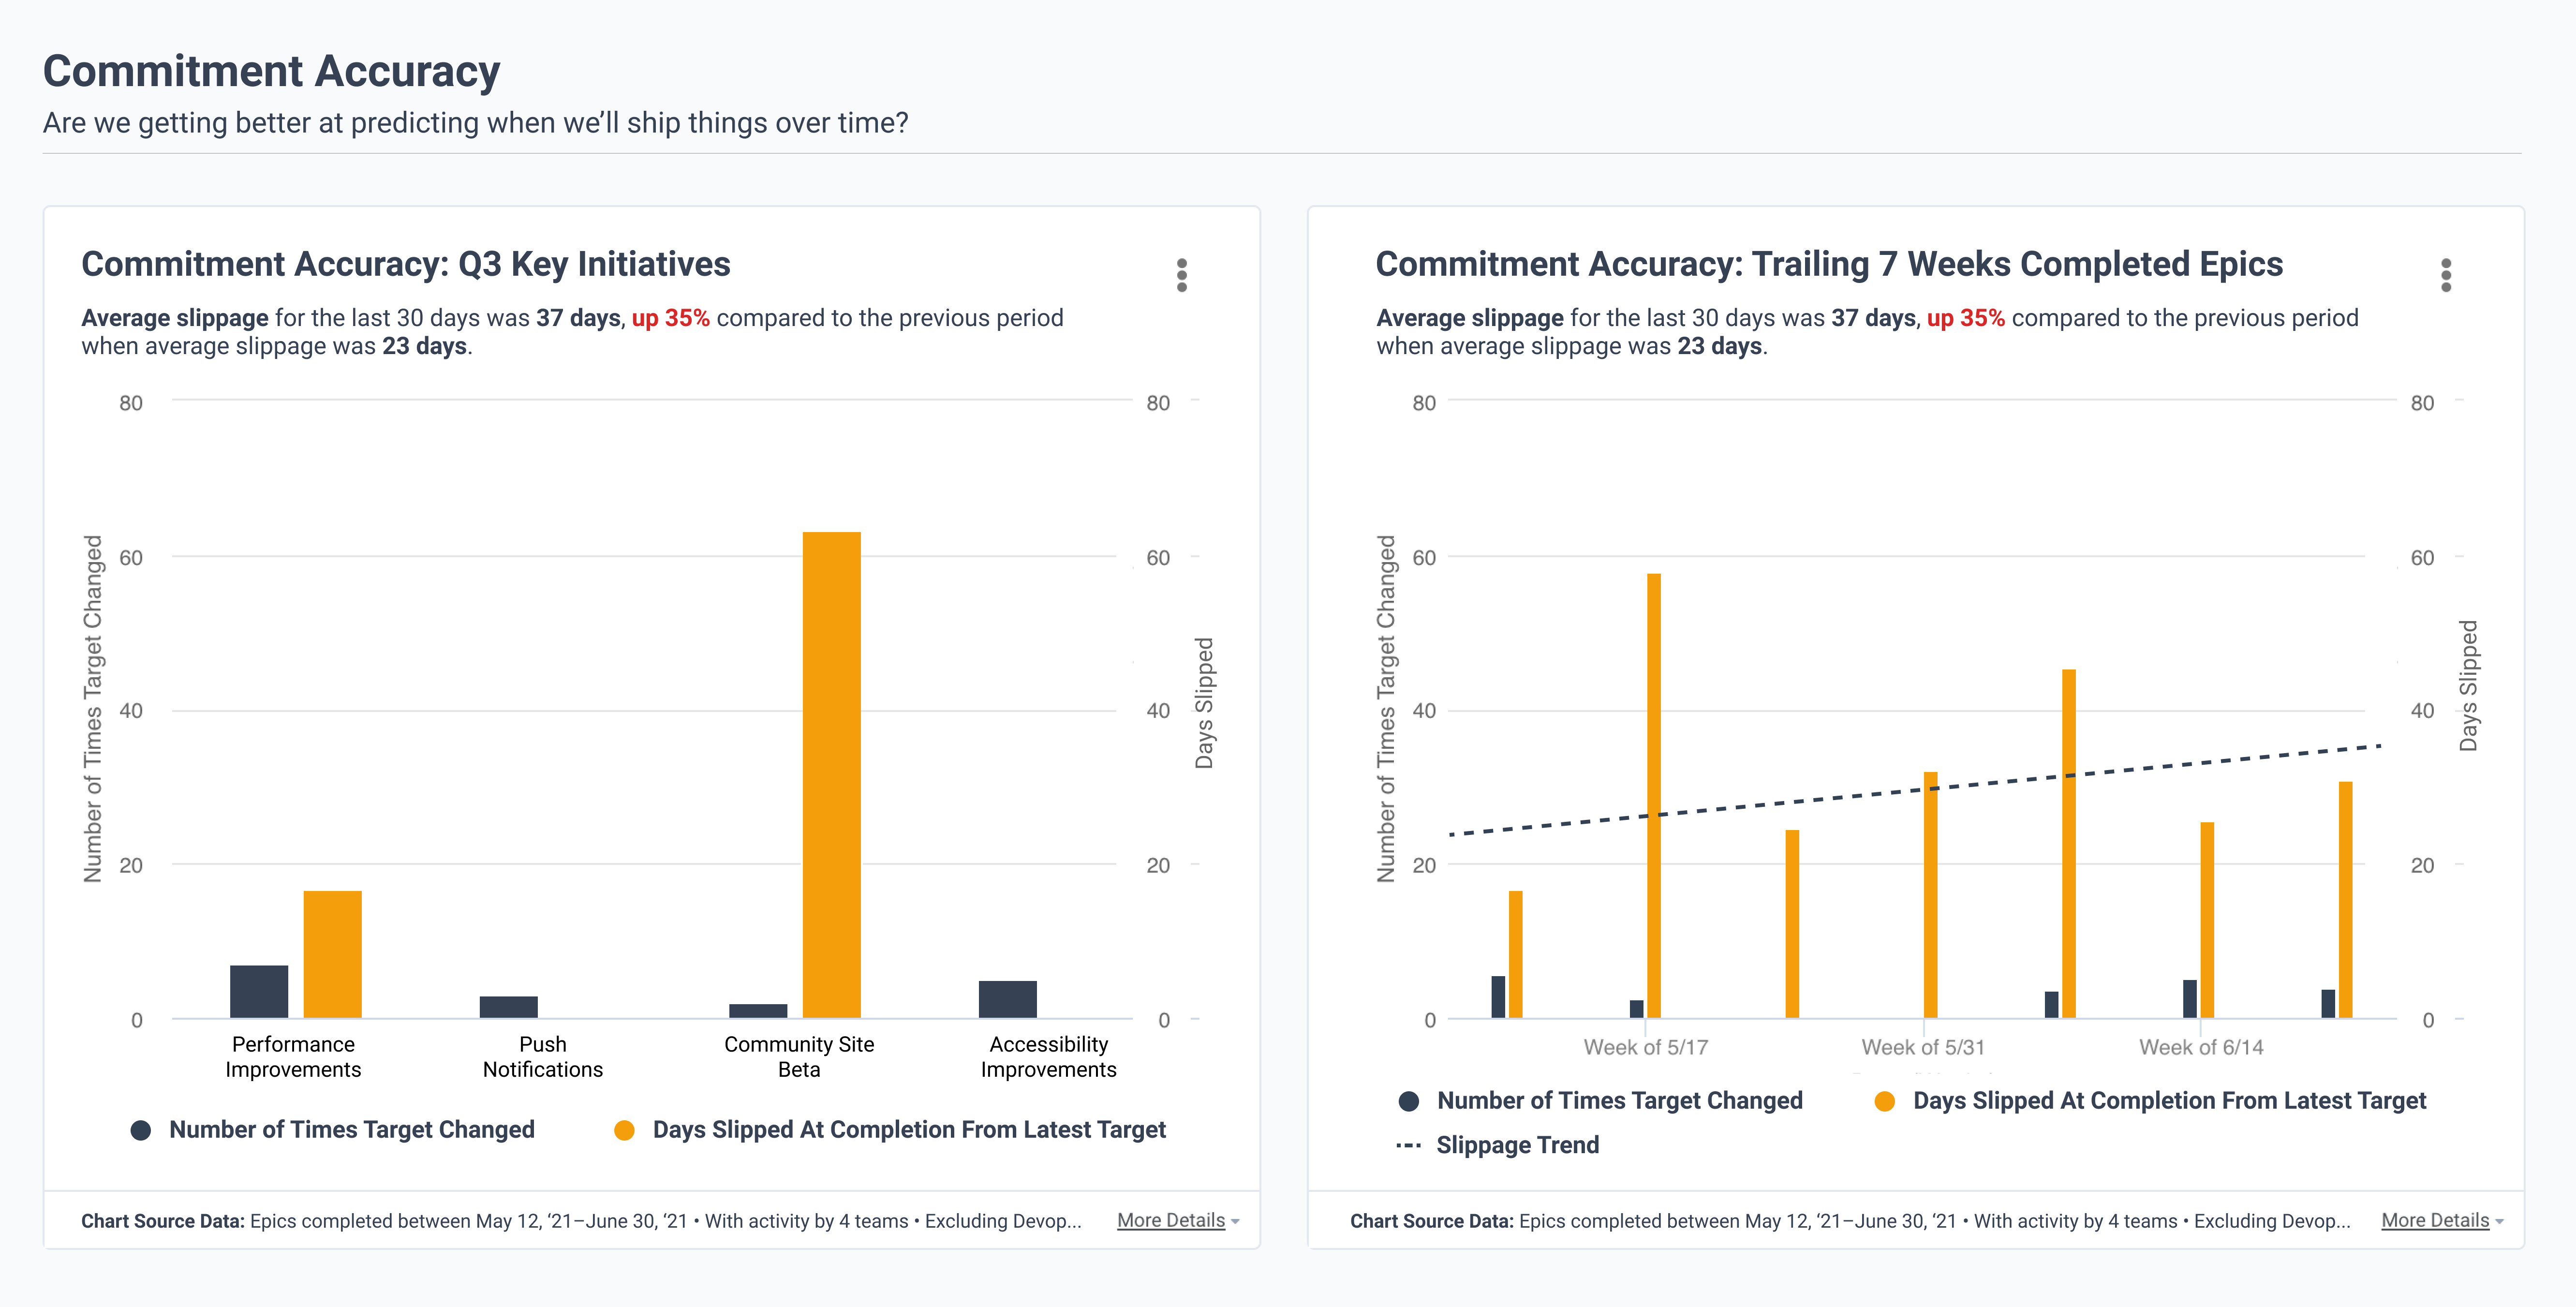
Over the next few quarters we will be introducing new Executive-level metrics and out-of-the-box dashboards to give leaders this high-level look across the organization needed to answer questions like:
- How many value-creating features did we complete last quarter?
- What was the overall investment by category?
- When we make a commitment how accurate are we?
- How often are we changing our commitments and by how much?
A peek under the hood on forecasted delivery dates
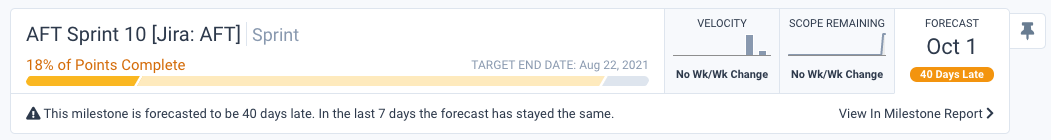
Our intelligent forecasting is key to product stakeholders understanding when initiatives will be completed and identifying areas of risks when something is running behind -- or earlier than expected. We’re enhancing our forecasting algorithms to support more advanced cases such as dependent tasks, scenario planning, and more.
In addition to updating the algorithm to refine forecasting, we also want to demystify the “magic” around our algorithms and analysis to improve confidence in the forecasted dates by exposing and ranking factors in the UI driving those forecasts.
Below you can see our current forecasting in action on the Portfolio Report and the explanation we provide today. You can look forward to much more granular detail soon.
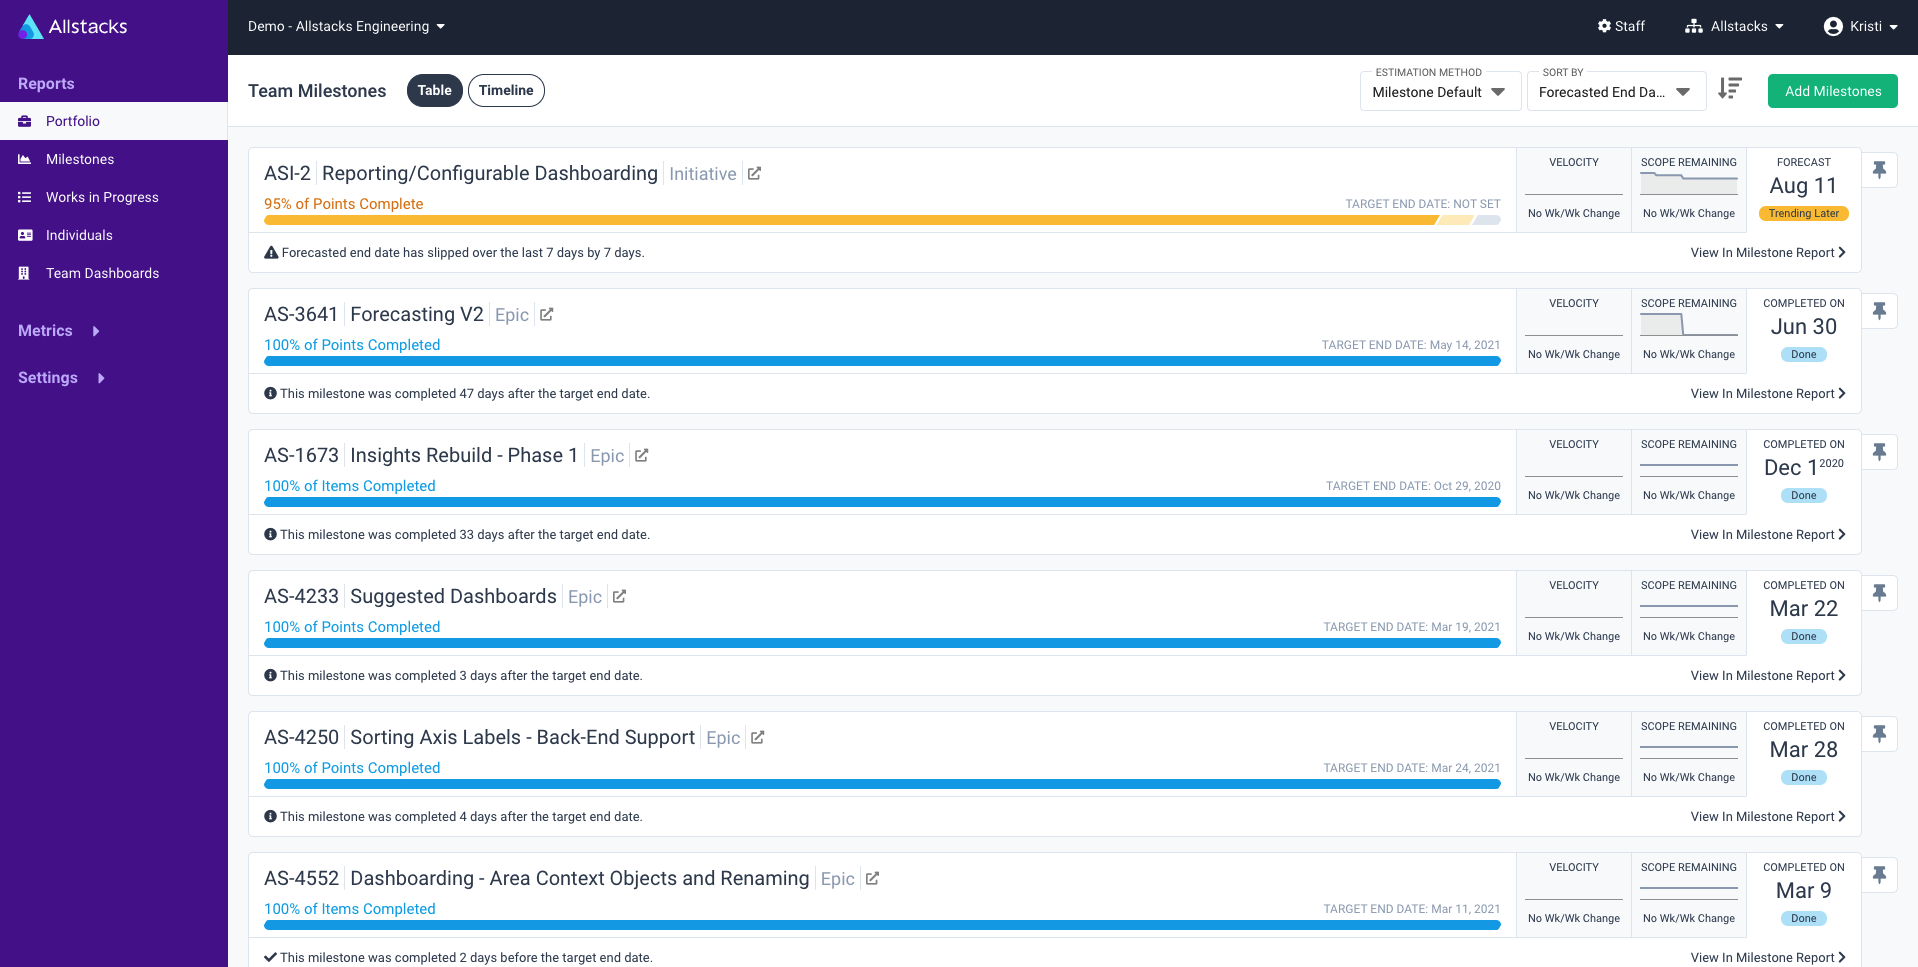
Visualize engineering focus against your key Milestones
Along with completion forecasting, current engineering focus is a key signal illuminating whether a milestone stays on track. We are adding these signals to our portfolio report in both the table view and the new timeline view to give you a higher resolution view of the health of your milestones. A refreshed table view UI will make more efficient use of space and enable quick column sorting for more effective triage.
.png?width=1488&name=image%20(1).png)
Refreshed UI
Lastly, Allstacks recently debuted a new look for our brand (you can learn more about that here) that highlights our bright and bold customer community, shows off our signature approachability, and represents an important behind-the-scenes evolution in our vision and product roadmap. Our app is officially brought up to speed with the brand. Customers will notice more improvements to the UI over the quarter to ensure consistency and ease of use throughout the app.
Turning the lights on and beyond!
Consistent (yet meaningful) reporting has long been challenging for software organizations due to different processes and methodologies deployed across teams. We believe these initiatives will help customers continue to evolve beyond simply turning on the lights for themselves and are using Allstacks to standardize how they report across their organization.
-Hersh