.png)


Company News
The first-ever, real-time Engineering Performance Industry Benchmarks has arrived. Free to access. See how you stack up and set goals for continuous improvement.

Reporting on your organization’s software delivery performance without the context of industry performance is notoriously difficult. There's simply no conversion chart for turning anecdotes into meaningful yardsticks. And as a software leader, it's your job to help the rest of your business understand what’s good and what should you expect from your organization—but how?
To answer these questions and more, we developed the Engineering Performance Industry benchmarks.
Just like you, our benchmarks are always improving. Available as a live dashboard and sourced from Allstacks’ anonymized global data set, the benchmarks offer software leaders and their teams a framework to contextualize their performance against, allowing them to set meaningful goals and expectations. And as part of our commitment to improving how organizations deliver software, they’re accessible to everyone for free.
To help understand the breadth and depth of what metrics and benchmarks are available, we’re sharing the metrics included in the benchmarks, represented by the commonly asked questions by software organizations.

The 5 Metrics in the Engineering Performance Industry Benchmarks
- How many days per week do teams write code?
- What percentage of issues are planned vs. unplanned?
- What are the cycle times by issue type?
- What types of code do teams produce?
- What is the average commit size for companies?
Read on for more details on each...
1. How many days per week do teams write code?
Every software team operates differently, but we ultimately want to understand how much time our engineers spend developing software each week.
The Coding Days metric helps teams understand if engineers have sufficient focus time—or if they even have time to code at all. It can also determine if teams get stuck in other activities like meetings, which can be the opposite of productive. Leaders can compare their productivity and capacity to the baseline on a week-to-week basis—and see how they stack up.
2. What percentage of issues are planned vs. unplanned?
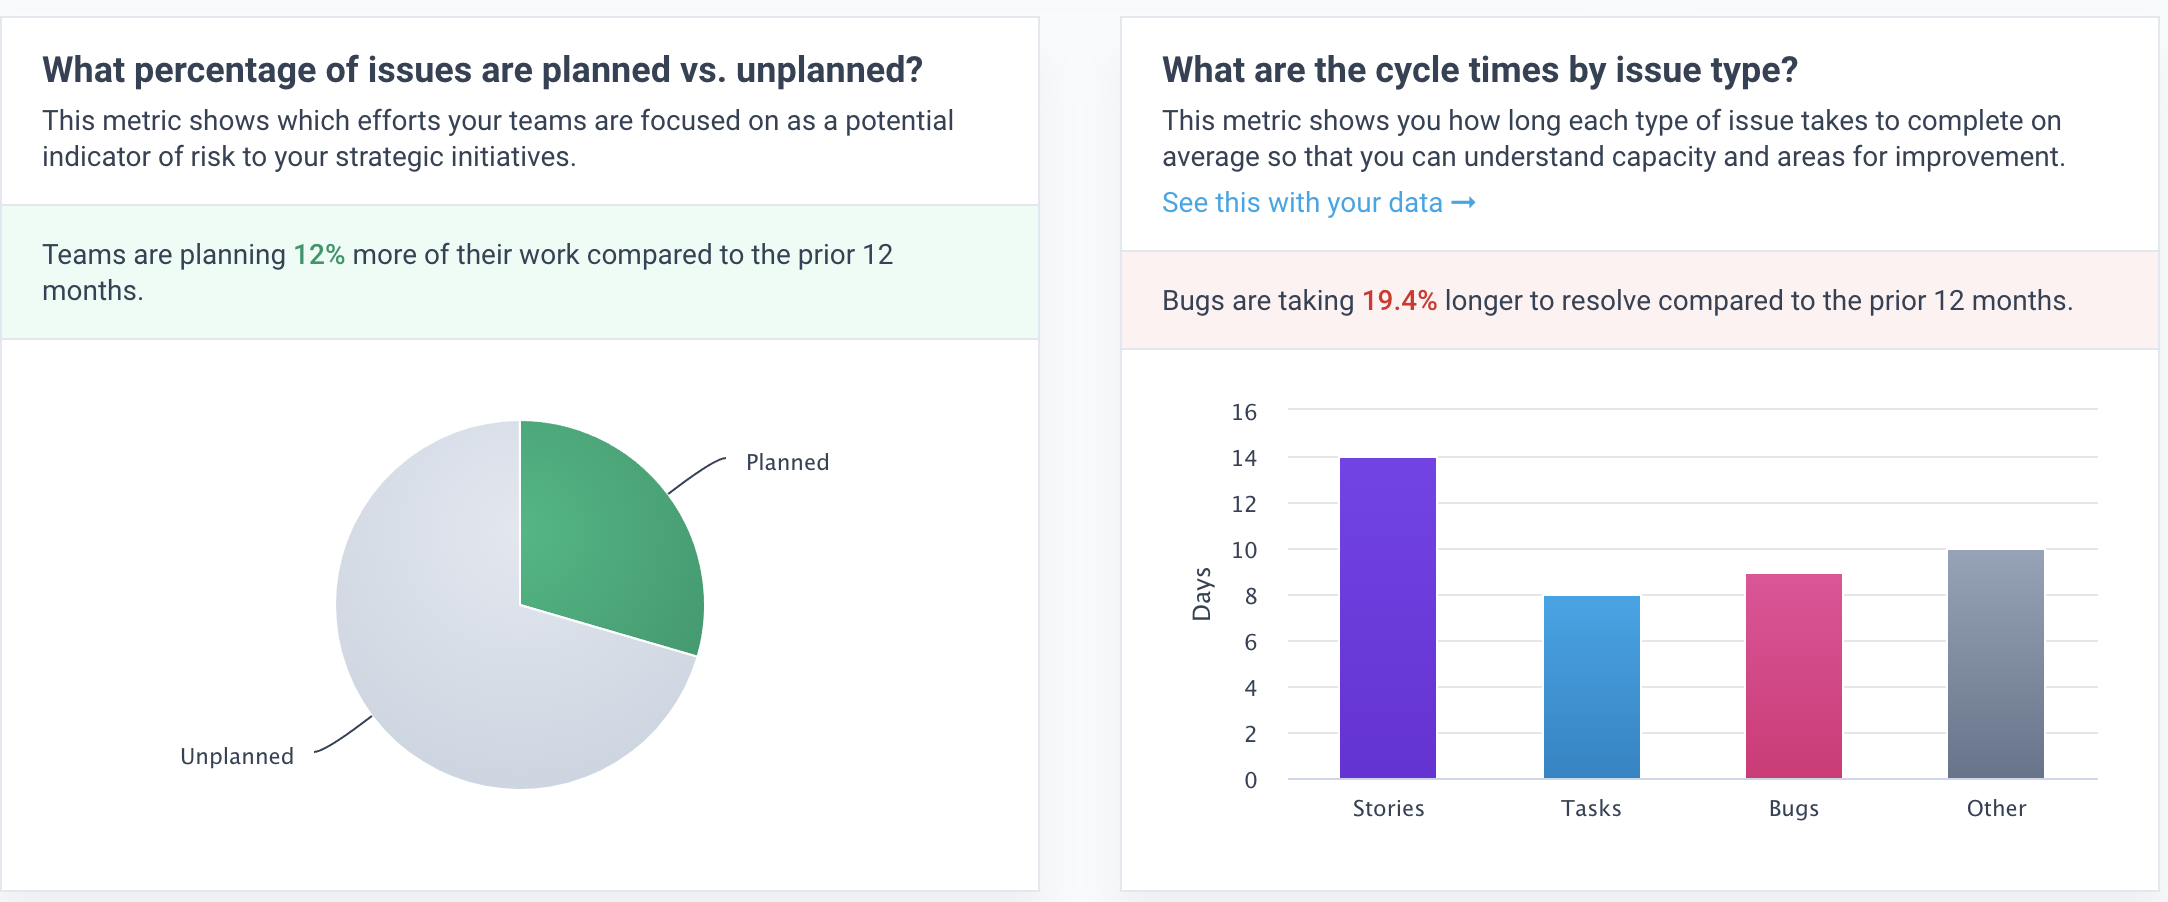
The Planned vs. Unplanned metric shows the distribution of work between planned work and interrupted work. This signals a team's capacity and potential risk indicators to strategic initiatives. This metric also demonstrates how much of our delivered work we could plan vs. things brought to the team, like escaped defects, one-off feature requests, and other, often uncoordinated work.
3. What are the cycle times by issue type?
Cycle Time by Issue Type metric illustrates how we approach and complete different types of work. Not every type of work functions the same, and often some types of work necessitate faster cycle times than others. Cycle Time by Issue Type breaks down the types of issues worked on and how long the team takes to resolve each respective type.
With this benchmark, you can understand your organization's capacity to address different types of issues while highlighting areas where you might be spending too much or too little time. You can also use it to manage stakeholder expectations on delivery timelines or effort.
4. What types of code do teams produce?
Different tasks result in other behaviors in the codebase. When net-new features are under development, we expect to grow and add to the code base, categorized in this metric as "New Work." Sometimes the work to develop new features can pose challenges, resulting in engineers rewriting code in a short period or "churn." While some churn is an expected artifact of the iterative process of solving complex problems, too much churn can be a sign of developers spinning their wheels in the mud and could lead to downstream maintainability challenges.
Maintaining a healthy ratio of New Work to Churn is a helpful indicator of future maintainability and hygiene, while an increase in "legacy refactoring" (rebuilding older parts of the codebase) can be a leading indicator of escaped defects.
While code churn may be inevitable, it’s best to avoid it as much as possible. Read Forbes’ take on why it may be a silent killer.
5. What is the average commit size for companies?
When significant, infrequent commits surface, it can be challenging for teams to adequately review code—leading to downstream defects and maintainability nightmares. It also becomes challenging to help the rest of the team understand what is being developed. Knowledge transfer can become stifled, leading to a high bus factor.
The Commit metric seeks to correct this by focusing on small and frequent commits, helping teams iterate quickly on features, effectively review code, and drive overall maintainability in the codebase.

Trends from November 2020-2021
Represented here are trends we've observed in the data, which are particularly interesting as the way we work continues to shift:
- Teams are coding 5.8% fewer days compared to the prior 12 months.
- Teams are planning 12% more of their work compared to the prior 12 months.
- Bugs are taking 19.4% longer to resolve compared to the prior 12 months.
You can see how changes in behavior impact delivery. These insights ultimately lead to a better understanding of where risks and opportunities for improvement lie.
Engineering Performance Benchmark FAQs
(Ok, no one asked, but we think you might)
Why did we choose these particular metrics?
We’ve spoken to thousands of engineering and product leaders over the last several years. While organizations have unique workflows, each needs to set targets based on how their organization performs relative to the industry at large. The metrics represented in the Engineering Performance Benchmark help teams understand their behaviors while accounting for different workflows and unique behaviors. The data is independent of an organization or team’s size, workflow, and development environment, making these metrics universally applicable for self-assessment.
What is the source data for the benchmarks?
The data in the benchmarks is an aggregated, anonymized global data set from our user base, which grows every day as more organizations come on board. Today the Benchmarks are built from 4 core types of data and their respective metadata:
- +10,000,000 Commits
- +1,000,000 PRs
- +3,000,000 Issues
- +250,000 Contributors
While you do not need to be a user of Allstacks to access the benchmarks, you can easily contribute to the data set. By starting a free trial of Allstacks, you can help improve our collective Benchmarks while evaluating the Allstacks Value Stream Intelligence platform for your organization. Connecting your tools is quick, and our SOC2 Type II platform keeps your data safe and anonymous. You can read up on our security and data privacy standards here.
Without the collective industry, this data and the insights in the benchmarks wouldn’t be possible. We’re honored to continue these industry benchmarks and further enable our ecosystem to invest in continuous improvement.
How frequently is it updated?
Daily. The best part about hosting the benchmarks on our platform, rather than a static data analysis, is that the metrics are updated ever day. We know that the environment around building software is complex and ever-changing, which requires up-to-date metrics. The benchmarks react to the world at large, so you can see how the industry is performing even as major external factors manifest.
See how you stack up.
You can access the Benchmarks right now. We'd also love to show you a personalized demo and get your started with a free trial so you can see these metrics and trends with your own data. You can schedule a demo here.
As we bring these benchmarks into focus, founder and CTO Jeremy Freeman looks back on his business trajectory and shares insights he learned along the way, from starting out his father’s plumbing and electrical business to building Allstacks from the ground up. Read more in the blog.