.png)
Software Engineering Intelligence
-
Intelligence Engine
On-demand exhaustive AI-analysis
-
Engineering Investment
Complete visibility into time & dollars spent
-
360º Insights
Create meaningful reports and dashboards
-
Project Forecasting
Track and forecast all deliverables
DevEx
-
Developer Surveys
Create and share developer surveys
Software Capitalization
-
R&D Capitalization Reporting
Align and track development costs
Using the Metrics Page - Allstacks Onboarding Series
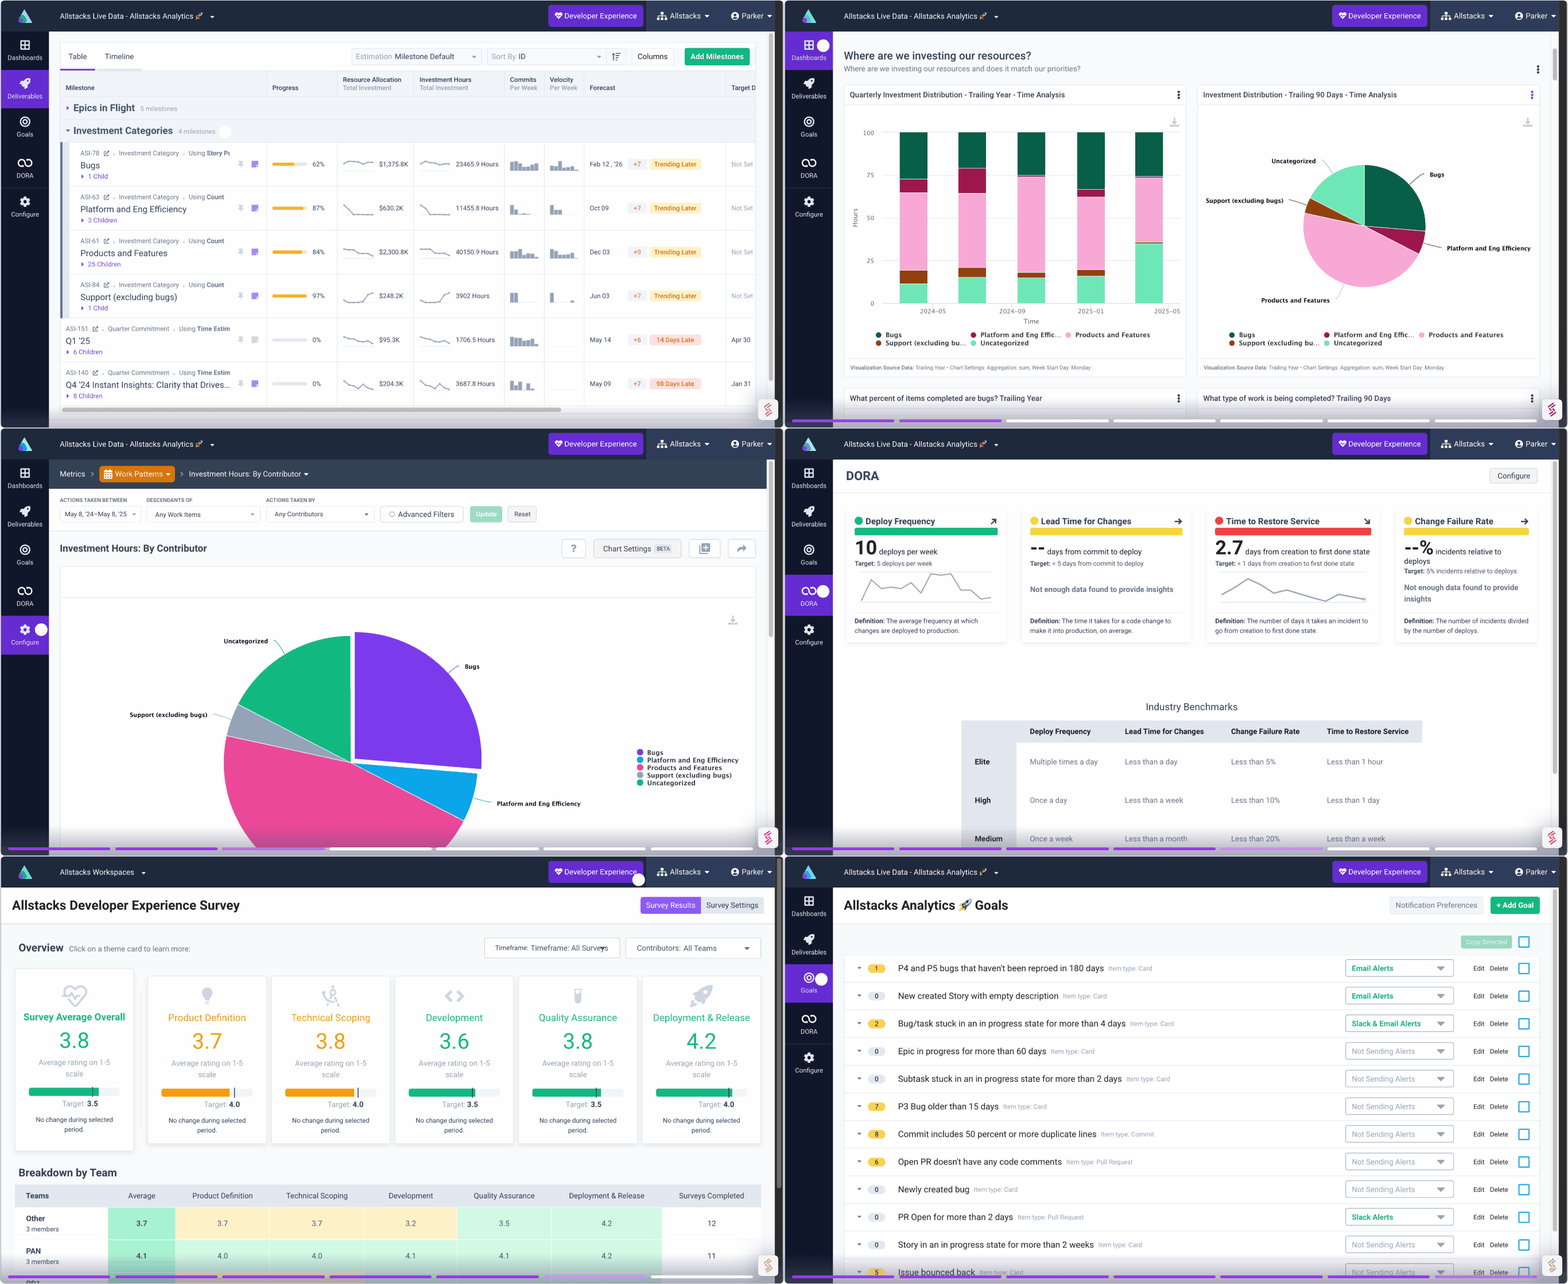
Harness the Allstacks Metrics Page: from custom views, dynamic filters, to varied visualizations, tailored to showcase precise metric insights.

Written by
Parker Ennis
Published June 29, 2024
The Allstacks Metrics Page, while uniform in structure, varies in application depending on the metric being evaluated. At its core, the page has default views, filters to refine data, and visualization tools for custom displays. In our issue cycle time example, you can select date ranges, assign filters like Jira projects, or individual contributors, and visualize data as heatmaps, stacked columns, etc. You can then save or share these customized views, ensuring clarity and precision for diverse organizational requirements.
Content You May Also Like
How Product Management Can Use Engineering Metrics to Drive Better Delivery Outcomes
Continuing our discussion from last week on engineering managers and planning, we now shift our focus. This week, we'll jump into how Product teams...
Read More
Metrics Viewpoint (Update): If You Can't Measure It, You Can't Manage It! - From Every Angle
Today, let’s discuss how to put a metrics approach that is inclusive of both quantitative and qualitative points of view.
Read More
Metrics Viewpoint: Creating a Balanced Metrics Approach
As we discussed in our Crawl, Walk, Run series, tracking your software development lifecycle effectively requires a balanced approach across multiple...
Read More


%20If%20You%20Cant%20Measure%20It%2c%20You%20Cant%20Manage%20It!%20-%20From%20Every%20Angle.png)
