4 Reports for Results-Driven Software Delivery — Allstacks
Can you answer, Was this release successful? and Did we make the right investment? Probably not. Allstacks has 4 out-of-the-box software delivery reports that make it easy.
Without goals, teams are hard-pressed to prove value. However, goals can be further broken down into two supportive buckets - leading indicators and lagging indicators. Leading and lagging indicators help projects stay on track and keep their focus. For clarity, leading indicators are incremental goals achieved in short timelines and provide insights for future success. Examples of leading goals include sprint or release burndown, cycle time, and team velocity. Lagging indicators often look backward and for a more extended time (quarter or year). Lagging indicators also measure actual business value, such as reduced churn, increased user adoption, or faster-recognized revenue. But for many Engineering and Product teams, setting the right goals is challenging. We've previously shared some best practices on developing engineering KPIs for those looking to get started.
Agility and flexibility are requirements for most software teams. It's no secret, building software that people buy and fully adopt is complex. Bugs, lost code, server outages, or even unexpected software breaks are just a few of the variables a product team might encounter. To complicate things further, teams rely on multiple tools to keep stakeholders and management informed. This results in repetitive, manual work across all these tools to keep everyone informed and on schedule — there has to be a better way, right? The dissonance and frustration aren't contained just within the product teams. In most cases, stakeholders outside of Product might be pointing the finger at the team building the solution and wishing for better insights into bullied cycles, release schedules, and efficiency opportunities.
Establishing measurable goals is valuable to teams and the business and recognizes the stakeholder management requirements. How can a product and engineering team do it all without essentially becoming system admins and business analysts scouring through data?
4 Out-of-the-Box Allstacks Reports
Your data should work for you, not the other way around. You should gain insights from your data without manual aggregation efforts, changing your processes, or "cleaning up" the data first. This will require a purpose-built solution for engineering teams that aggregates the different data sources from Jira, GitHub, Confluence, and other software delivery tools into a single intelligence platform that leverages modern technology like AI and machine learning.
The Allstacks platform does all of this and provides predictive forecasting based on your team's historical data to show what is working and what isn't, potentially eliminating problems that can derail projects and negatively impact the bottom line. Out-of-the-box reports include:
AI-Powered Portfolio Forecasting Report
AI-powered forecasting insights surface roadblocks and time-consuming tasks across multiple teams, departments, and projects to help reduce product delivery time. Constantly learning from the tools you already use, this report aggregates data and surfaces intelligent insights. Teams benefit from the results with more in-depth conversations that allow for fluid adjustments and even better stakeholder management.
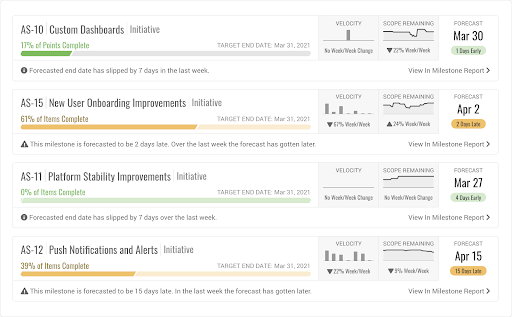
Take an interactive tour of the Portfolio Report here.
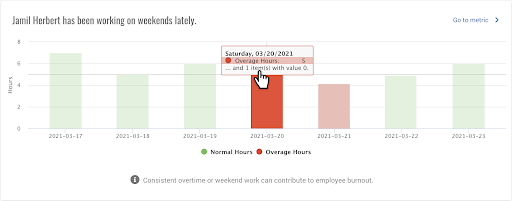
Manager and Agile PM Report
Evaluate workloads and understand where individuals are spending their time to ensure burnout and prolonged periods of intense stress are avoided.
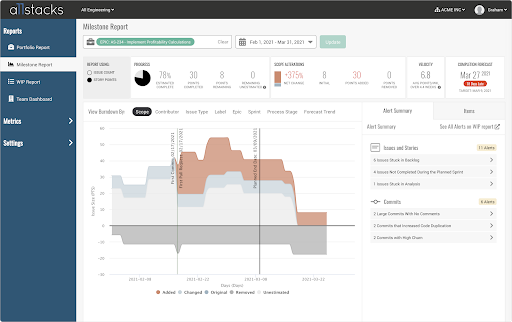
Milestone Report
Clearing the data fuzz and getting focused on the right goals can quickly start with out-of-the-box dashboards like the Allstacks Milestone Report. This dashboard keeps the executive team informed of what is going on with a project on the roadmap. The Milestone Report helps you identify issues around scope creep and process issues that can stall out a project before you know it.
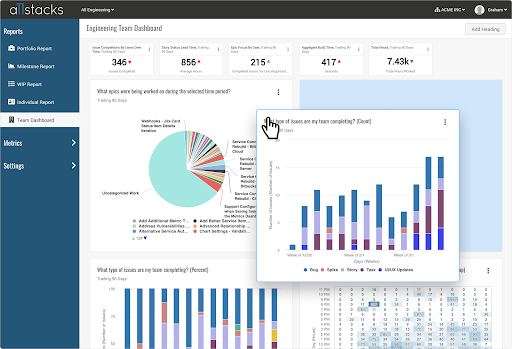
Analytics Dashboard
The real-time analytics dashboard provides a clear look at performance metrics that help improve individual and team productivity and keep a project moving. The ability to make data-driven decisions can help ensure benchmarks are being met along the way.

Improving Results Even While Distributed
Allstacks is a powerful platform for any team, even those working from home, the corporate office, or another country. We were able to use these reports and more insights from our platform to see what impact COVID-19 and transitioning to remote work had on engineering performance. You can see the data for yourself in the People, Process, and Outcomes: COVID-19 and the State of Software Development report.
During this time, when we have all been working remotely by necessity, the engineering team at ClearData used Allstacks to stay focused and reach their goals.
Darryl Hyde, former VP of Product at ClearData, when asked how work patterns have adapted and how they have stayed focused on stakeholder deliverables said it this way:
"More than ever, we're reliant on data to help us make decisions. We are a highly customer-driven organization—customer and market feedback drives everything that we do. A byproduct of that is that customers need us to meet the timelines we commit to on our roadmap as they often have downstream dependencies on those features. This makes predictable execution and delivery critical, and without a tool like Allstacks giving you that visibility, you're really flying blind."
There's no reason for flying blind, whether working remotely or in person. A solid goal-oriented process with the right platform leads to clear visibility and better outcomes.
James Emerson, VP of Engineering at ClearData, says it best:
"As we grow, we need better visibility to make decisions based on data and metrics, not gut. We use many tools across Product and Engineering. With Allstacks, we now have a single pane of glass for all of that information and have access to a lot of data we weren't getting before."
To see these reports with your own data, schedule a demo. Your first 30-days are on us — no contract needed.
Table of contents


/ get started /
