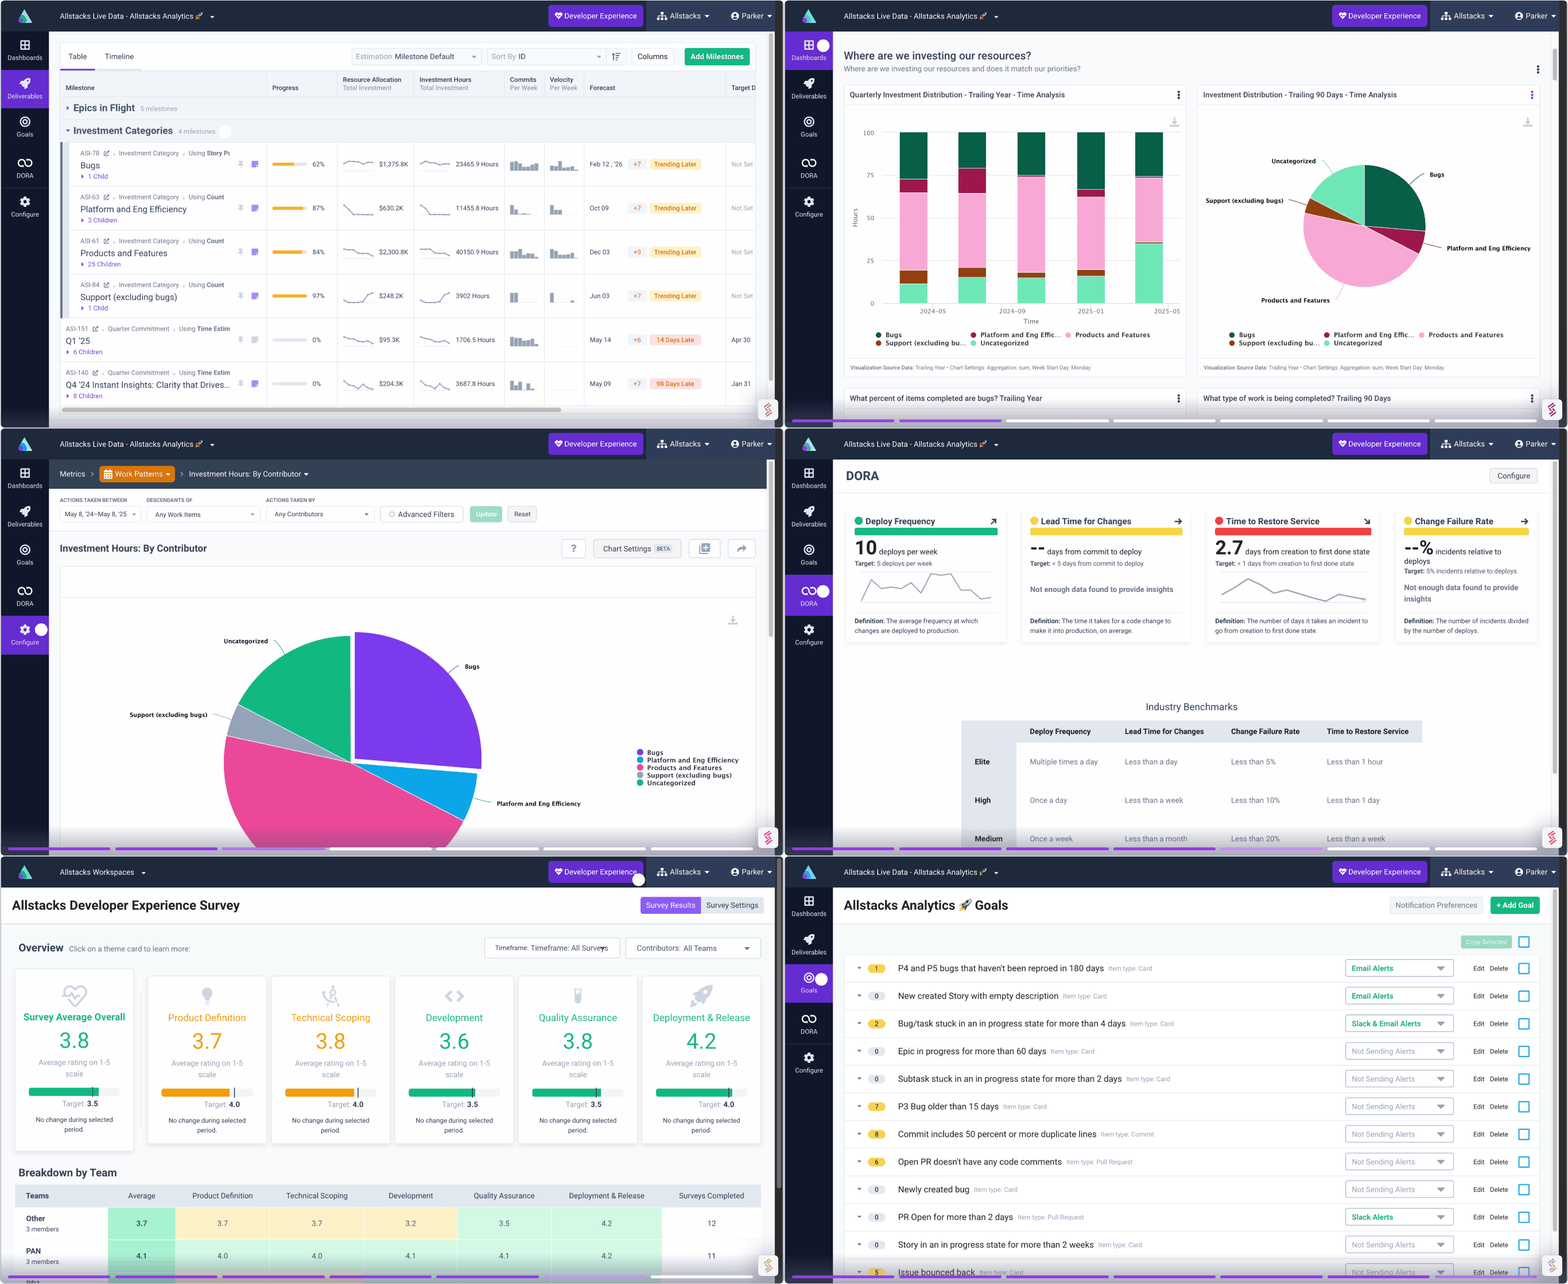
.png)
Software Engineering Intelligence
-
Intelligence Engine
On-demand exhaustive AI-analysis
-
Engineering Investment
Complete visibility into time & dollars spent
-
360º Insights
Create meaningful reports and dashboards
-
Project Forecasting
Track and forecast all deliverables
DevEx
-
Developer Surveys
Create and share developer surveys
Software Capitalization
-
R&D Capitalization Reporting
Align and track development costs
Allstacks Webinar Recap - Metrics in Motion: Transforming Data into Action
The real-time demonstration of Allstacks' capabilities really brought our discussion of engineering metrics to life - hosted by our Director of Product Management, Graham Langdon and our Head of Engineering, Jim Grundner. For those who couldn't make it, let us walk you through how we connected theory to practice.
.png)
Transforming Data Into Action
Throughout the webinar, we toggled between discussion and live Allstacks platform demonstrations, showing how engineering leaders can turn high-level engineering metrics concepts into actionable insights. One of the session highlights was exploring how to align capacity in real-time with a 90-day planning approach . As we explored how to leverage the platform's 90-day planning view, participants could see how their peers are using these forecasts to optimize team workload and align individual work to organizational objectives.
Here are a few actionable strategies we discussed that you can incorporate into your own processes:
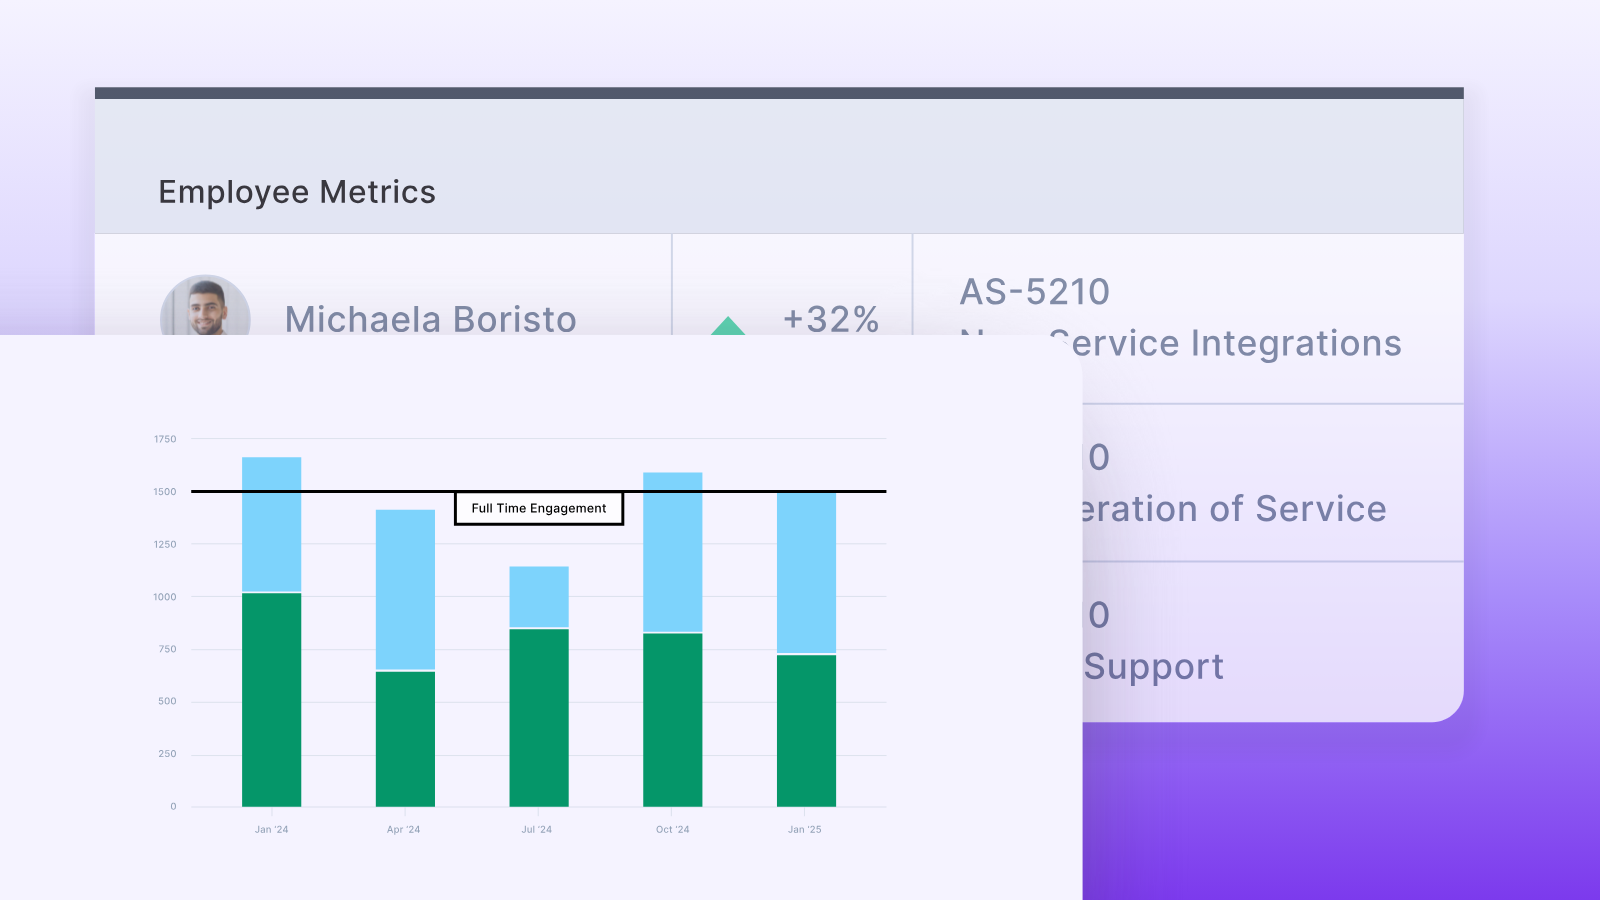
- Effective budget and time allocation: Check the effectiveness of your budget and time allocations to determine if your initiatives will cost what you projected. This can be accomplished through investment hours analysis.
- Aim to build transparency between goals and work: Create total transparency between organizational goals and the work of individuals and teams. We need to be sure the targeted work is well understood by team members and completely aligned with quarterly initiatives. Check to ensure non-targeted work does not get started without full agreement in the organization.
- Use Data Visualization for productive conversations: Visualization of data doesn’t solve underlying productivity issues - but it does shine a light on them in order to facilitate the appropriate subsequent conversations.
In our capacity planning segment, the demo sparked an engaging discussion around tracking focus time versus meeting overhead and monitoring velocity trends across sprints. We showed how Allstacks can automatically track focus time versus meeting overhead, while simultaneously monitoring velocity trends across sprints. The conversation amongst attendees was focused on seeing how these metrics surface potential delivery risks before they impact timelines.
Real-World Application with Allstacks
In order to make risk management tangible, we showcased examples of early warning systems, tracking delivery forecasts, budget adherence, and sprint performance in real time. . Many participants commented on how seeing these metrics unified in a single Allstacks dashboard made risk assessment more intuitive and actionable.
The practical highlight was our walkthrough of Allstacks' continuous improvement features. We showed how teams use our trend analysis tools to identify patterns in their development cycles and make data-driven adjustments to their processes. The platform's ability to connect historical performance with future planning generated lots of questions during our Q&A—we noticed recurring theme on how effective software organizations measure relevant engineering patterns to understand and continuously improve overall performance.
Start Improving Your Metrics Today
Now, I know I am a bit biased, but as we demonstrated in the webinar, Allstacks offers a powerful solution to make implementing these insights easier and more impactful. You get a unified dashboard that brings together real-time metrics on capacity, focus time, sprint performance, and risk management. Tracking these metrics holistically enables you to monitor progress against budget and timeline forecasts, fostering transparency between team goals and organizational objectives.
Thanks again for making this such an interactive session. Your questions and real-time feedback during the demo helped showcase how this data can help solve real-world engineering challenges. If you missed the live webinar, you can view the recording anytime here.
For those interested in seeing these features in action again, or if you’d like to discuss your metrics journey, we're offering one-on-one follow-up sessions with Graham and Jim to focus on your team's specific needs. Just reach out to Jim on LinkedIn and mention this blog post—we look forward to strategizing with you!


%20If%20You%20Cant%20Measure%20It%2c%20You%20Cant%20Manage%20It!%20-%20From%20Every%20Angle.png)