.png)


Reduce friction points
Easily gather developer feedback using existing tools like Slack, making it both simple and quick for teams to assess and share their experience


Shorten feedback loops
Strengthen survey results with comments and additional context so teams can easily collaborate and improve in real time
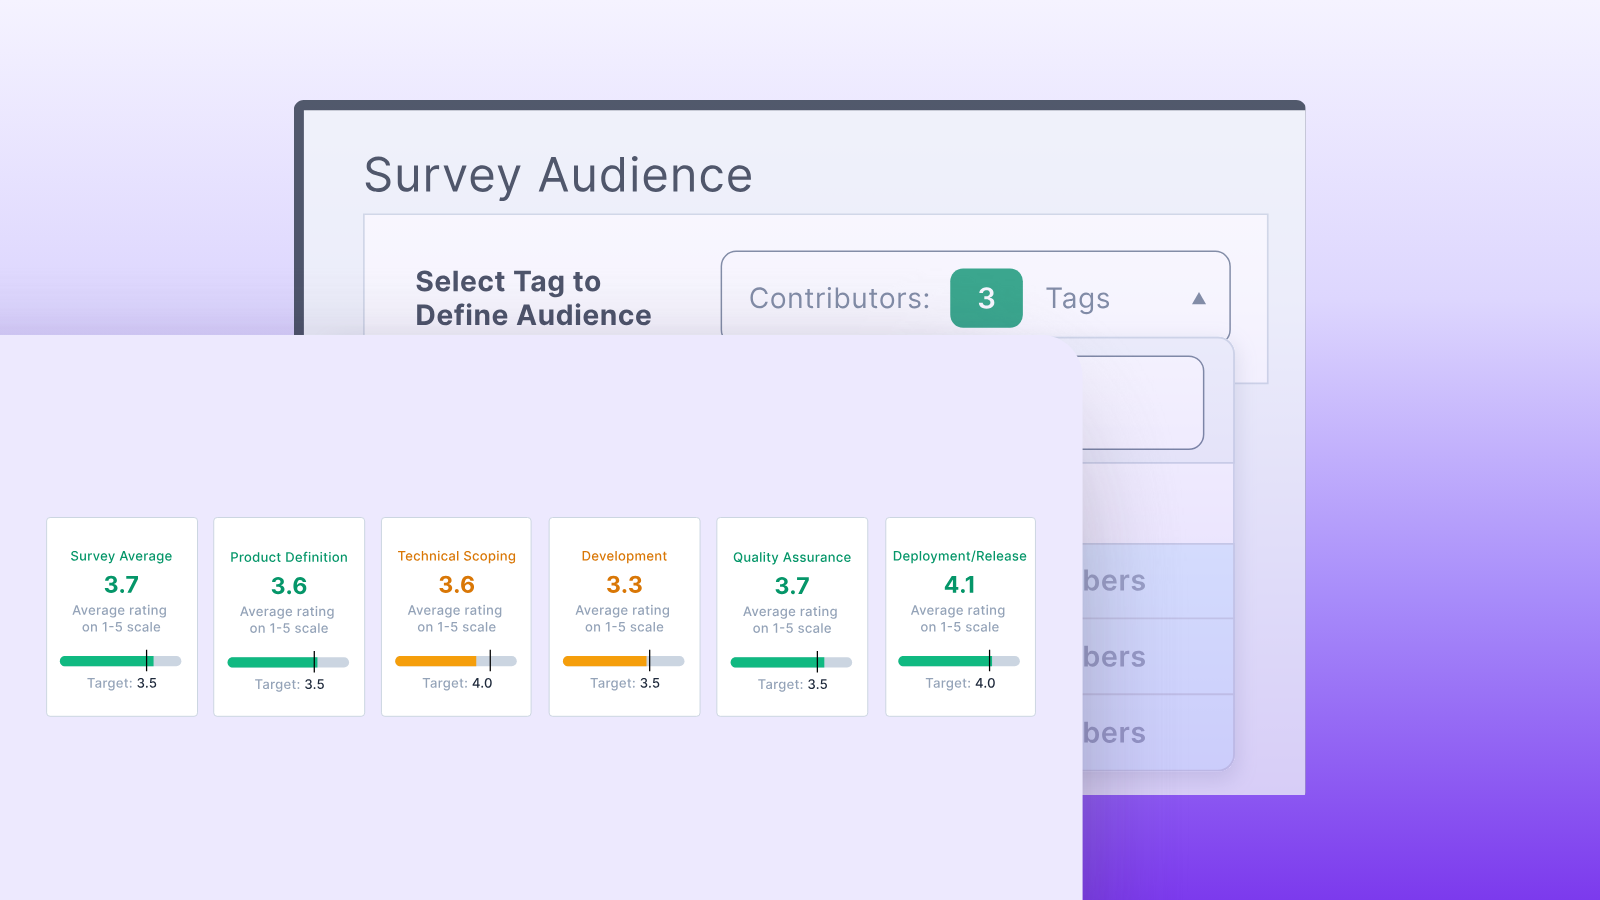
Encourage continuous improvement
Automatically aggregate and score developer experience data to identify trends, compare results across your organization, and drive sustainable, long-term improvements


We’re no longer working on things that don’t move the needle. Also, we’re focused on things that matter and teams are rallying around that—it’s all hands on deck.

ShareFile
Sharefile shaves cycle time by 32% & improves PR response time by 25% with Allstacks

"Allstacks’ core value is providing visibility into problems. I can organize all of my engineering processes in one place to quickly make changes and better understand where my inefficiencies lie. I get a clear picture of where we are."
John Steinmetz
,
VP of Data & Analytics
Related content
%20If%20You%20Cant%20Measure%20It%2c%20You%20Cant%20Manage%20It!%20-%20From%20Every%20Angle.png)