
Product Management KPIs That Actually Matter (and the New Ones AI Added)
A product manager's guide to the KPIs that matter, the accountability model behind them, and the AI product metrics most KPI lists still leave out.

Gage Hollen
Senior Product Marketing Manager
Date
July 21, 2026
Tags
Best Practices

You own product adoption, retention, and whether the team built the right thing at all. Then leadership asks how the latest release went, and the signals are scattered across five tools, half of them lagging by a month. Some you own, some you only influence, and some you don't track yet. You need a product management KPI guide that helps you understand the ones that matter most. (and AI product management software that reads from your delivery systems pulls those signals back into one place.)
What's the KPI TL;DR
- Sort every KPI by accountability: the product metrics you own, the business metrics you influence, and the engagement metrics you monitor.
- Own your input metrics (activation, feature adoption, retention curves), they will impact the output metrics you're accountable for (product revenue, net retention).
- AI added two new product management metric families, trust and cost metrics for AI features (acceptance rate, human-in-the-loop rate, cost per action, model drift).
The product management KPIs you own, influence, and monitor
As a product manager, you have unlimited metrics at your disposal to help you determine your product's success. The cleanest way to sort them is to stack them into three pillars, ordered by how much control you actually have. At the base sit the engagement metrics you monitor as early signals, like DAU/MAU, session depth, and feature adoption. In the middle sit the product metrics you own outright, your North Star along with activation, retention, and conversion. At the top sit the business metrics you influence but rarely move alone, like MRR/ARR, LTV, and gross margin.
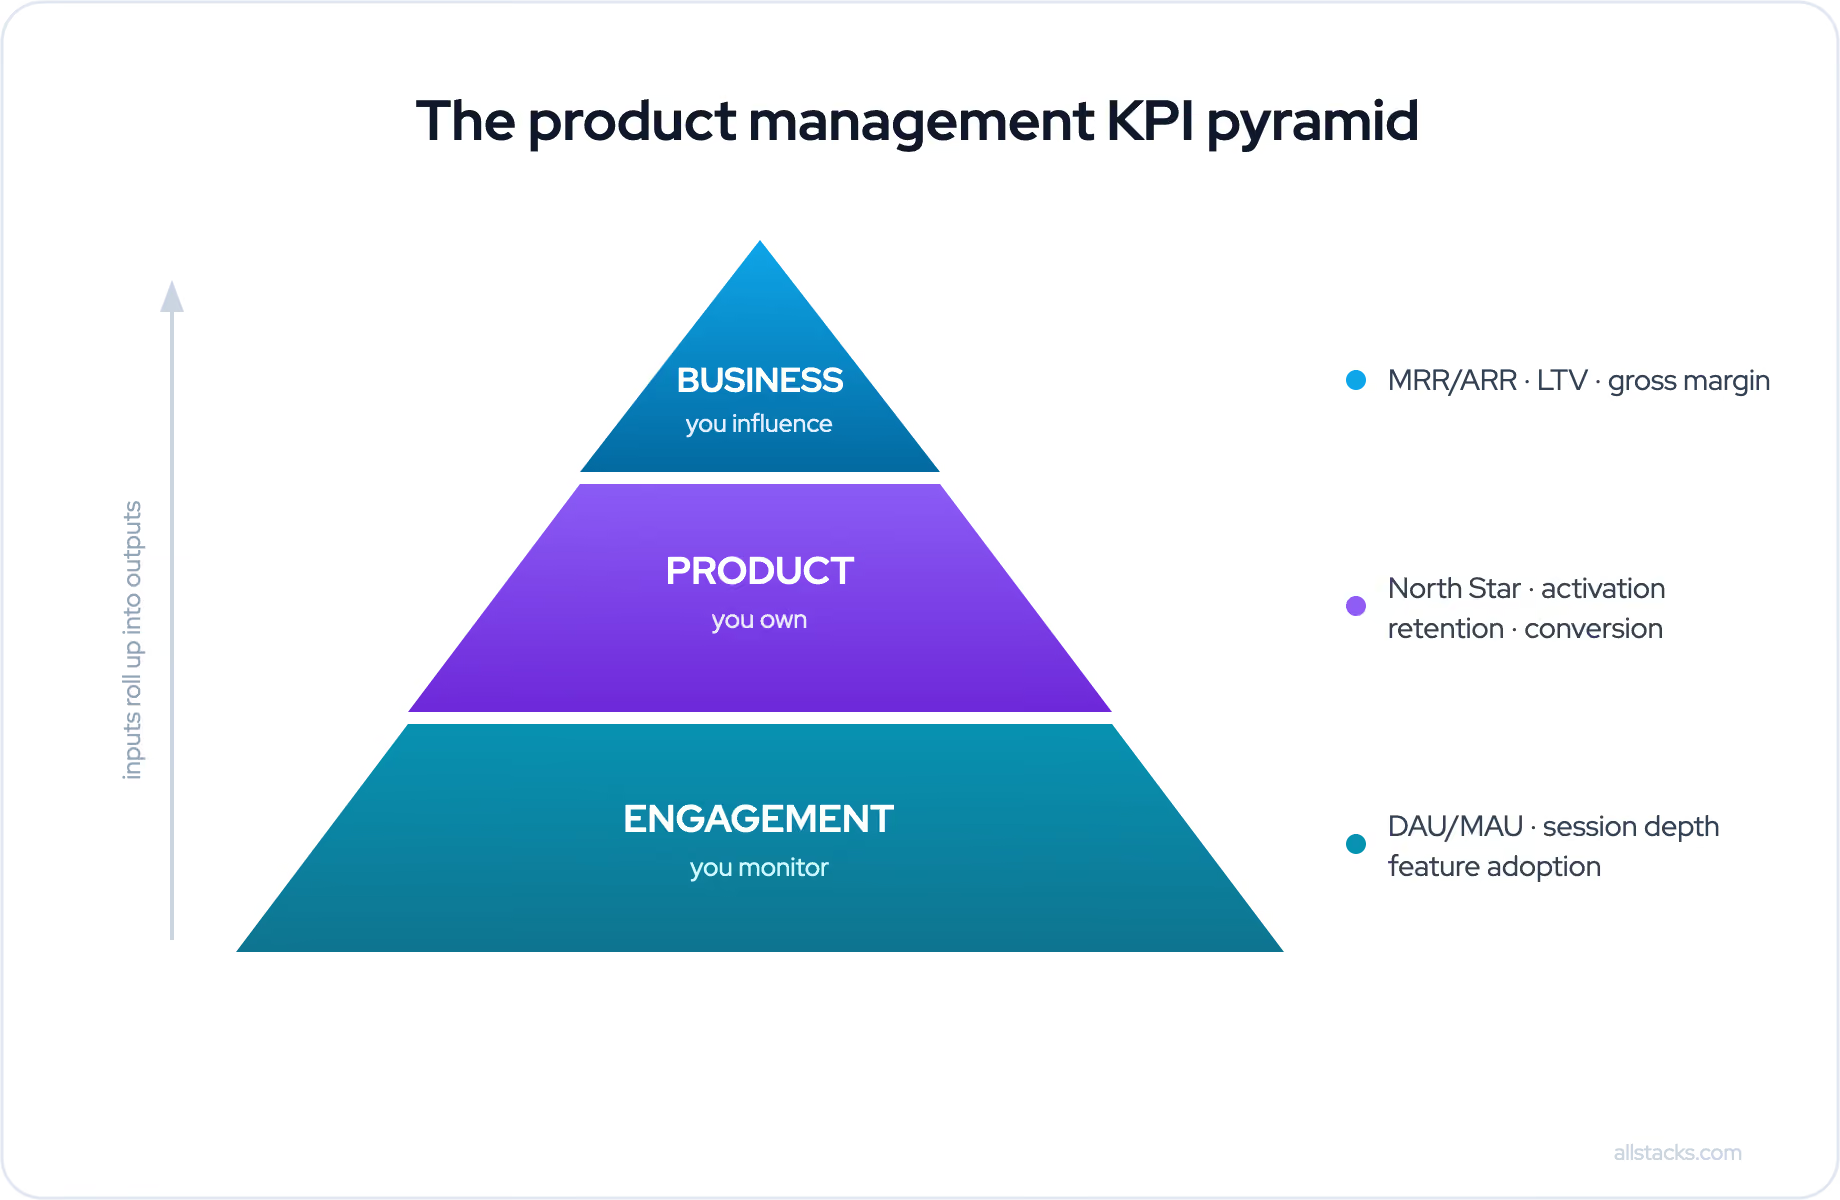
The difference between the inputs and outputs matters here. Josh Seiden's book, "outcomes over output," and the practice of OKRs draw a line between input and output metrics. Input metrics are the ones you push directly, like activation and feature adoption. They roll up into output metrics you cannot touch on your own, like revenue and net retention. Put the three pillars together, and the model gives you a more complete picture of where you actually have leverage.
The product metrics you own, from activation to retention
This is the pillar you can have a direct impact on, and where your effort compounds fastest as a product manager.
- Activation rate. The share of new users who reach the first value. Benchmark data across 62 B2B companies puts the average near 37.5 percent. Above 40 percent is strong, above 50 percent is exceptional, and clearing 60 percent usually means the milestone is too easy rather than the onboarding is great.
- Time to value. For B2B tools, the quoted bar is under an hour to the first value, though the median often lags by more than a day.
- Feature adoption rate. Whether the thing you shipped is actually used. Core-feature adoption averages around 24.5 percent, a useful reality check the next time a roadmap assumes everyone will find a new capability.
- Retention. Track Day 1, Day 7, and Day 30 retention by cohort. When the curve flattens instead of decaying to zero, you are seeing the clearest product-market fit signal there is.
- Stickiness (DAU divided by MAU). Above 20 percent is the monitor-tier habit signal feeding your North Star.
If you track one thing, make it activation. It is the earliest input you fully own.
The business metrics you influence, from revenue to NRR
These are the numbers that are influenced by your involvement throughout the lifecycle of the customer. The satisfaction metrics move first and the revenue metrics follow, which is why both belong on your dashboard even though you never move them alone.
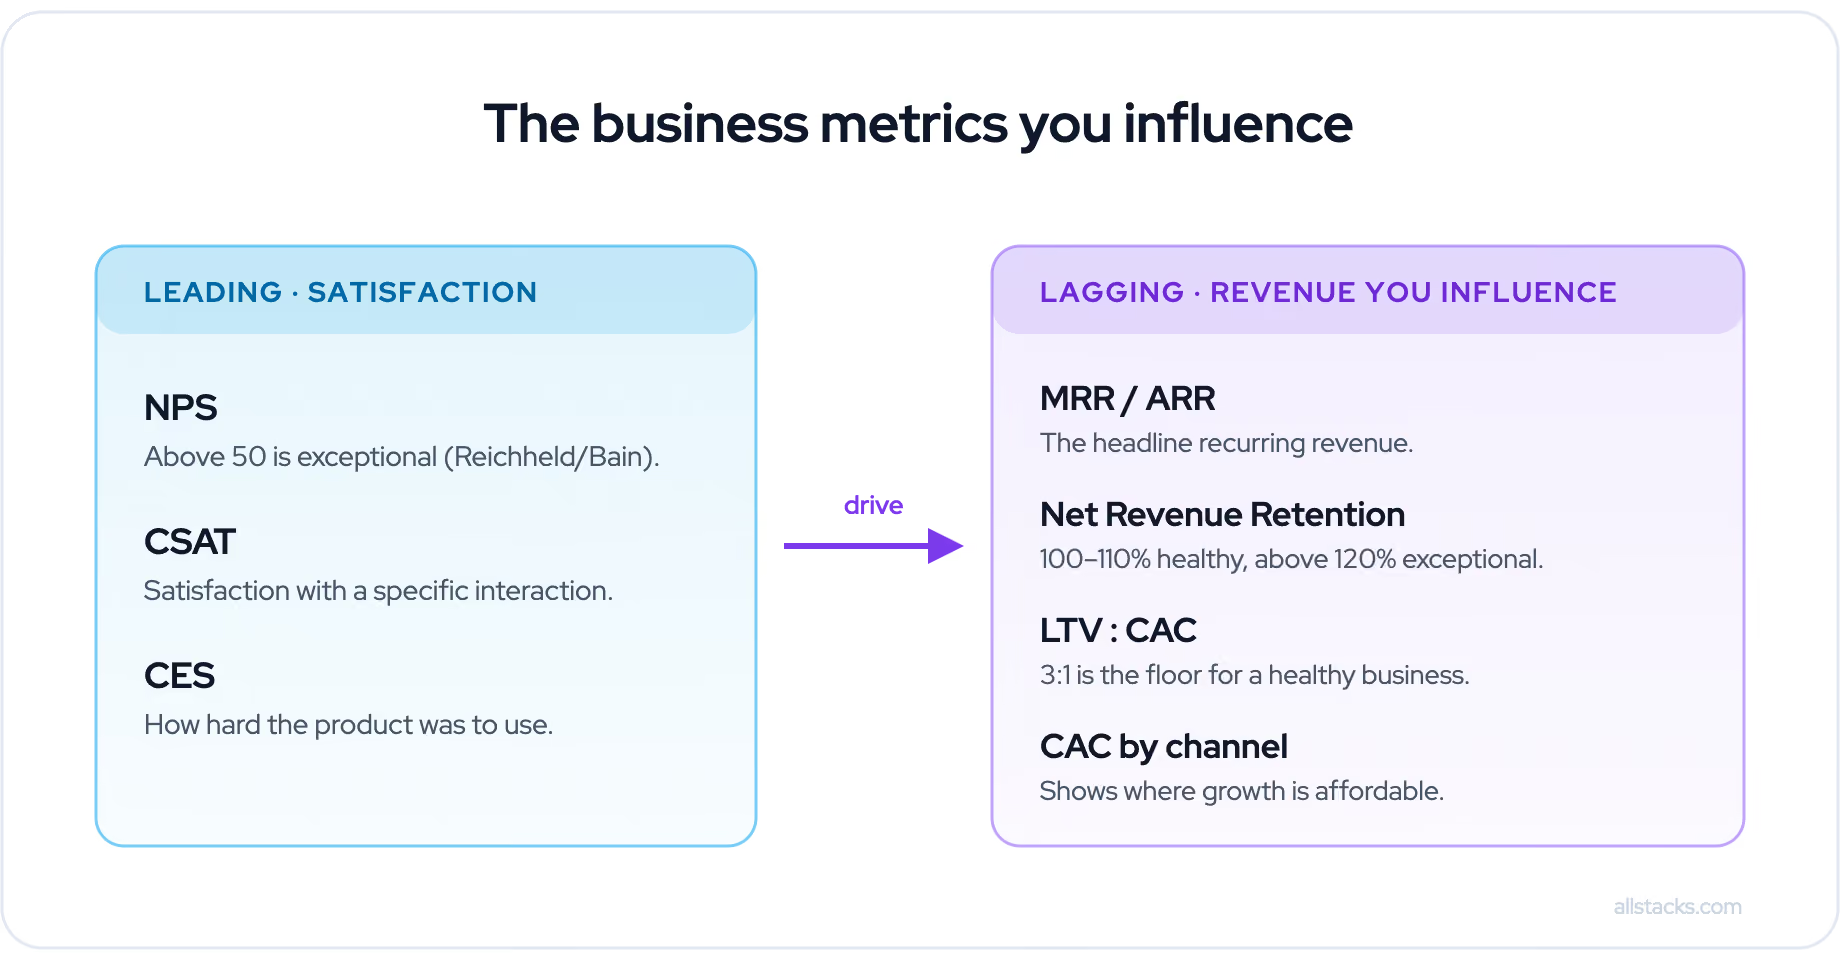
The job in this tier is to walk into the review able to show which owned input is bending the output. Adoption depth is usually the lever sitting directly under net retention, so make that connection clear.
The new AI product metrics every PM should track
Products that include AI need metrics that traditional dashboards were never built to capture. It is easy to measure usage, but that only tells you people clicked on something. It does not tell you whether the output was any good, or whether the user found value in the interaction.
Start with the two trust signals. AI acceptance rate is the share of AI suggestions users accept, and human-in-the-loop rate is how often a person has to override the model. Read together, they tell you whether the feature is trusted or merely tolerated. Then come the quality metrics your engineers already track. Precision measures how many of the model's answers were correct, recall measures how many of the correct answers it actually found, and F1 rolls those two into a single balanced score. Inference latency belongs here as well, usually written as p50, p90, and p99, meaning the response time that 50, 90, and 99 percent of requests come in under, because a slow suggestion is a rejected one. Two more decide whether the feature survives contact with a budget. Cost per prediction, or per action, is the unit economic most dashboards miss, and model drift tracks the slow decay in performance as the world moves away from the training data.
These are newer and less settled than the core metrics, so treat them as a working set rather than a fixed scorecard. Adoption alone flatters an AI feature, while acceptance and override rates tell you whether it is actually earning trust. Before you scale an AI feature, pair one trust metric with one cost metric. Acceptance rate and cost per action are a fine place to start.
Choosing your KPIs with North Star, AARRR, and HEART
Three frameworks get quoted constantly, and teams often adopt all three at once without noticing they answer different questions.
- North Star Metric. Aligns the team around one measure of customer value, a leading indicator of revenue rather than a vanity count, per Sean Ellis and Amplitude's criteria. Use it to point everyone at the same goal.
- AARRR (Dave McClure's pirate metrics). Acquisition, Activation, Retention, Referral, Revenue. The RARRA variant pulls Retention to the front when that is your constraint. Use it to diagnose where the funnel breaks.
- HEART (Google's Kerry Rodden). Happiness, Engagement, Adoption, Retention, Task success. Use it for a major UX investment where task-level quality is the question.
Reach for AARRR to find the leak, the North Star to align the team, and HEART when you are making a serious UX bet.
BONUS: Track requirements and spec readiness as a leading indicator for AI dev quality
Developers have always loathed the requirements and specifications handed over, but there has never been an objective quality gate the same way development cycles have had. To be successful, you have to build one.
Establish a requirements and spec readiness score. Create a 1-10 scoring framework based on what good looks like for acceptance criteria, edge cases, security architecture, and the rest (for more on the makeup of a good spec from an engineer's perspective, read about spec-driven development). Once you have that, run your requirements and specs through your own eval of what good is to give them a score. If it lands at or below 7 out of 10, improve it and run it again. Keep track of that score and weigh it against your other metrics to validate requirements and spec quality as a leading indicator.
You can also sign up (it's free) and use Allstacks Product Studio to research and create your requirements and specifications grounded in the reality of your customer voice, code and architecture, and design preferences. Each artifact gets scored for quality and readiness by AI reviewers to help you improve it before you send it.
FAQ
What are the most important KPIs for a product manager?
Owned input metrics come first. Activation rate, feature adoption, and retention read through cohort curves lead the list. Those are the ones you can move this quarter. Then the influenced outputs you are judged on, net revenue retention and NPS. Track a small set of inputs you control rather than reporting every number available.
What is the difference between a KPI and a metric in product management?
A metric is any measurement you can take, like session length or page views. A KPI is the short list of metrics tied directly to a goal you are accountable for. Every KPI is a metric, but most metrics are not KPIs. The skill is deciding which few actually indicate progress.
What KPIs should an AI product manager track?
For AI features, track AI acceptance rate and human-in-the-loop rate for trust, precision, recall, and F1 for quality, inference latency for speed, cost per action for unit economics, and model drift for decay over time. On the delivery side, add rework rate, the fifth DORA metric, introduced in its 2024 report.
How many KPIs should a product manager focus on?
A few needle-movers per goal. Own a handful of input metrics you can actually move, usually one North Star plus two or three supporting inputs like activation and retention. A long list feels thorough and reads as noise. Leadership remembers the three numbers that map to a decision.
Table of contents



/ get started /