
Measuring AI ROI: Why Most Engineering Leaders Are Reading the J-Curve Wrong
DORA's 2026 report shows AI ROI follows a J-curve: a productivity dip, then uplift. Most engineering orgs measure at the dip and call it failure.

Gage Hollen
Senior Product Marketing Manager
Date
May 26, 2026
Tags
Industry News
Best Practices
A quarter into your AI rollout, the dashboard tells you adoption is climbing and delivery has slowed. The natural read is that the tools are not working. The 2026 DORA data on measuring AI ROI says the natural read is also the most expensive one most engineering organizations are making this year.
AI adoption produces a productivity dip before uplift, and the median enterprise is checking the dashboard exactly when the curve is at its lowest point. The leaders who pulled back during the dip are the same leaders explaining flat returns to their CFOs in Q4.
We covered the spatial half of this thesis in our companion piece, DORA AI ROI Report (2026): Why Engineering Infrastructure, Not Tools, Drives Returns. This piece covers the temporal half.
What Is the AI ROI J-Curve DORA 2026 Identifies?
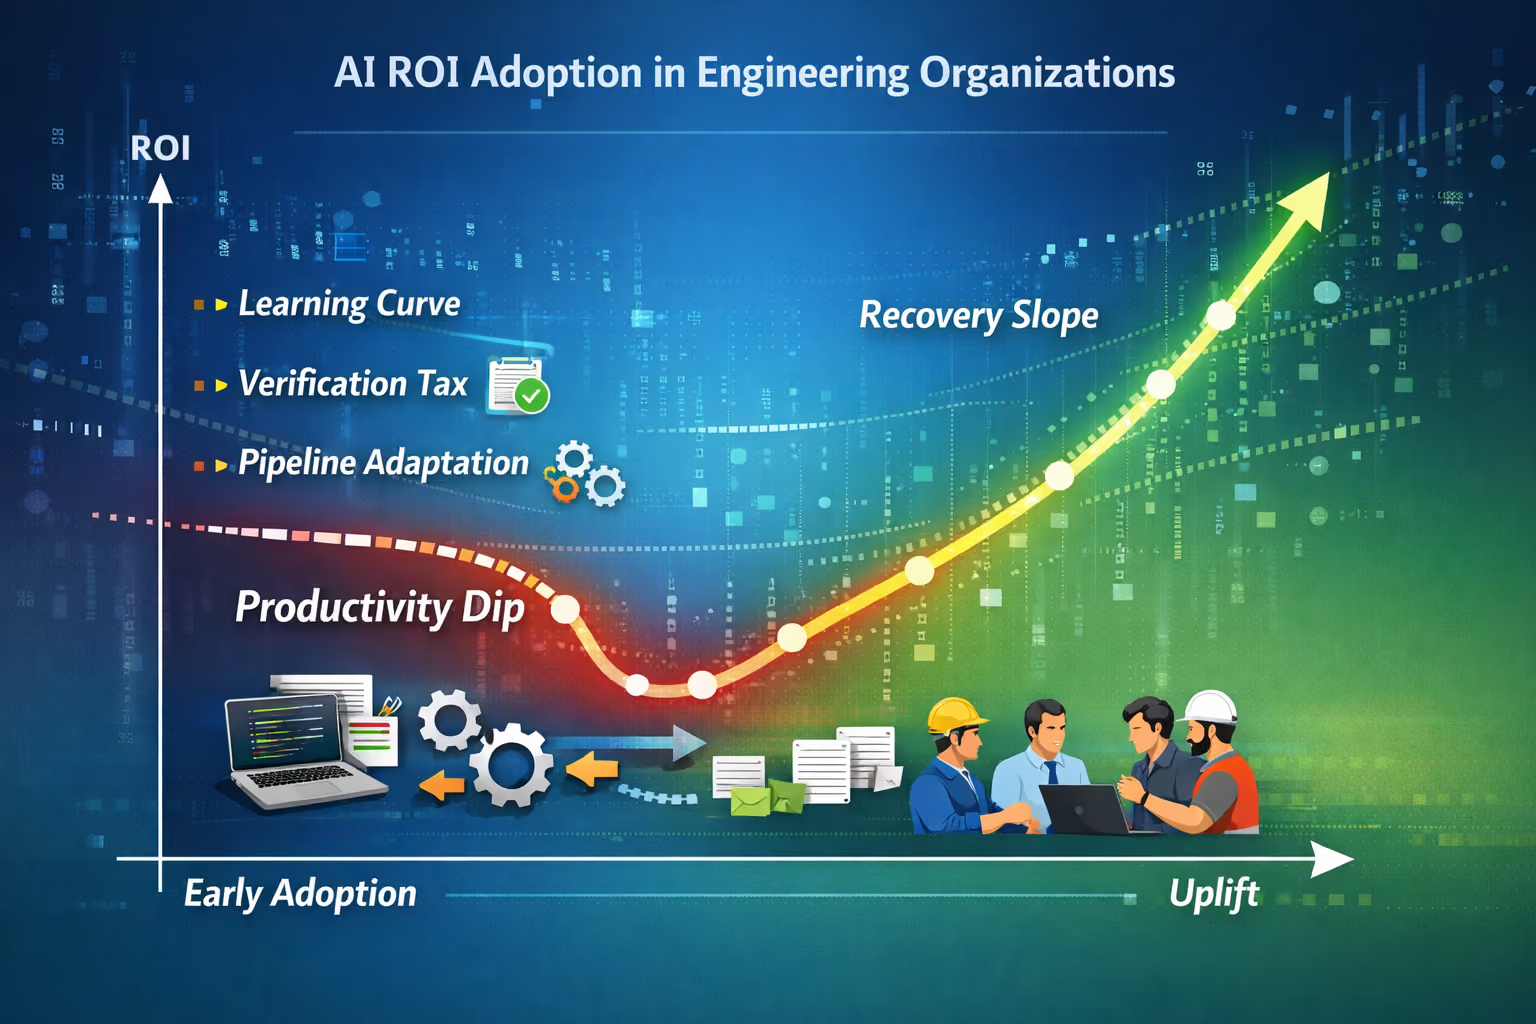
The AI ROI J-curve is DORA's model for the value-realization shape that AI adoption produces in engineering organizations: a measurable productivity dip during early rollout, followed by a recovery slope that compounds past the pre-adoption baseline.
The most important model in Google Cloud's DORA ROI of AI-Assisted Software Development (2026.01) report is not the financial calculation. It is the temporal one.
DORA's 2026 dataset surfaces this J-curve pattern across AI-adopting engineering organizations. The shape is consistent. Productivity dips during the early adoption phase, then the curve turns and uplift compounds, eventually exceeding the pre-adoption baseline. The dip is structural. The recovery is structural too. The duration varies, but the shape does not. The same J-curve has appeared in prior DORA research on continuous delivery and platform engineering rollouts.
DORA names three causes of the dip on the J-Curve chart (p. 4), in the report's own labels:
- The learning curve. Engineers adapt prompting patterns, integration habits, and review workflows. This costs throughput.
- The verification tax. DORA defines this directly as "the time developers spend reviewing AI outputs" (p. 40). Reviewing AI-generated code is not free, especially in complex codebases where AI output requires careful human inspection.
- Pipeline adaptation. Review pipelines, change-approval gates, and testing systems built for human-paced volume now process AI-paced volume. Capacity strain shows up before redesign happens.
DORA labels this entire period "the tuition cost of transformation" and recommends explicitly budgeting for it as a necessary investment in learning before long-term ROI materializes.
Two findings make the temporal model load-bearing for measuring AI ROI:
- The DORA AI ROI calculator models change failure rate rising from 5% to 6% post-adoption, producing approximately $344,000 in modeled negative downtime impact during the dip window alone. J-curve duration is the single most sensitive input in the calculator, so getting the dip-shape right matters more than getting the tool license cost right.
- The 2026.01 report explicitly cautions that AI ROI varies more by engineering system quality than by AI coding tools spend, meaning the same dip will produce very different recovery slopes depending on whether the rest of the engineering system is ready.
This is also why conventional AI ROI dashboards keep producing contradictory readings. PRs are up. Cycle time is up. Adoption is up. Change failure rate is up. What gets called the AI productivity paradox is not actually a paradox once the J-curve is named. The paradox is the dashboard. The curve is the underlying signal.
How Should Engineering Leaders Measure AI ROI Across the J-Curve?
The reframe that helps here is to stop treating AI ROI as a point-in-time number and start treating it as a curve with three measurable signals: where you are on the curve, what shape your curve has, and how fast your engineering system is letting you climb the recovery slope.
The Allstacks Intelligence Engine exists for this exact problem. Most ROI dashboards report a snapshot. A snapshot during the dip is not the absence of ROI. It is the absence of context.
The signal set that matters across the J-curve in 2026:
The leading indicator most engineering organizations are missing is review compression on AI-heavy PRs. When AI code volume rises faster than review throughput, the dip deepens and the recovery is delayed. Tracking the ratio of AI PR volume to merged-and-shipped AI PR volume tells you whether the system is absorbing the new throughput or queueing it.
The second leading indicator is rework rate by code origin. AI-generated code that is reworked within 48 hours of authoring is in the dip phase. AI-generated code reworked at the 30-day mark is on the recovery slope. The two patterns require different interventions. A snapshot will not tell you which one you are looking at. A 90-day curve will.
The third indicator, and the one most underused, is context engineering readiness against agentic invocation rate. DORA names context engineering as one of the two OpEx-side investments organizations need to navigate the J-curve dip (p. 44): developers must be equipped to act as high-level orchestrators, providing agents with precise business context and maintaining rigorous oversight. The report's framing of the underlying risk is direct: "In an agentic world, garbage in, garbage out refers to the context provided to the agent" (p. 44). In Allstacks's analysis, the operational expression of context engineering is spec quality. AI ROI degrades fastest when agents are given low-quality specs, and spec quality is upstream of every other AI ROI measurement. It is one of the few signals engineering leaders can move proactively. The companion piece on specification quality and AI in product management covers the upstream lever. The piece on your AI coding investment and why you can't prove it works covers the attribution layer.
The combined picture is the J-curve made legible. Measuring AI ROI without that picture is the equivalent of taking a single weather reading and calling it a climate.
How Do You Read the J-Curve in Your Own Engineering Org?
If you have rolled out AI assistance in the last 12 months and your ROI numbers are confusing, the first practical move is to stop comparing snapshot to snapshot and start mapping the curve.
The Allstacks Intelligence Engine maps the J-curve from your existing engineering data: GitHub or GitLab activity, Jira flow data, CI/CD signals, and AI-attributed code origin. The output is not a single ROI number. It is a system view that shows where on the curve each team is, what the recovery slope looks like, and which leading signals (context engineering readiness, review compression, rework rate, change failure trajectory) are predicting the next 90 days.
For engineering leaders trying to defend AI budget to a CFO, this is the operational surface where the J-curve gets translated into a credible ROI conversation. For context on how this connects to the underlying engineering infrastructure DORA identifies, see our companion piece on the engineering infrastructure that drives AI ROI returns [TODO: confirm final slug at publish], and on the AI productivity gap most engineering leaders can't see for the delivery-outcome lens.
The teams that produce credible AI ROI numbers in 2026 are not the teams with the most AI adoption. They are the teams that understand the dip they are in and the curve they are climbing. That distinction is where AI ROI conversations with the board get easier, and where the temptation to pull back during the dip stops costing organizations the uplift on the other side.
Stop Measuring AI ROI at the Wrong Point
The dashboards that confused engineering leaders in 2025 are not going to clarify in 2026. The fix is not a new vendor. It is a temporal model of AI ROI, anchored to the J-curve DORA documented this year, instrumented with the leading signals that tell you which side of the dip you are on.
Request a demo of the Allstacks Platform to see the J-curve mapped against your existing engineering data.
Sources Cited
- Google DORA, ROI of AI-Assisted Software Development (2026.01), April 2026. Primary source verified directly against the PDF: J-Curve of value realization with three labeled causes on p. 4 (the learning curve, the verification tax, pipeline adaptation), the "tuition cost of transformation" framing on p. 4, the modeled 5% to 6% change failure rate rise and the $344,000 downtime example on p. 27, the seven-capability AI Capabilities Model on p. 22, the five-key organizational foundation (trust, platform, data, users, guardrails) on p. 42, the "garbage in, garbage out refers to the context provided to the agent" framing on p. 44, the context engineering capability on p. 44, and the engineering-system-quality framing from the Executive Summary on p. 3.
- InfoQ, New DORA Report Claims Strong Engineering Foundations Drive AI Return on Investment, May 2026 (infoq.com/news/2026/05/dora-roi-ai-assisted-dev-report). Secondary coverage of the DORA 2026.01 report.
- Independent analyst commentary on DORA calculator sensitivity ($9.9M swing on a single J-curve duration assumption), surfaced via search of DORA 2026.01 coverage in May 2026.
Table of contents



/ get started /