.png)
Software Engineering Intelligence
-
Intelligence Engine
On-demand exhaustive AI-analysis
-
Engineering Investment
Complete visibility into time & dollars spent
-
360º Insights
Create meaningful reports and dashboards
-
Project Forecasting
Track and forecast all deliverables
DevEx
-
Developer Surveys
Create and share developer surveys
Software Capitalization
-
R&D Capitalization Reporting
Align and track development costs
Product Update | Dec. '23 | Revamped Dashboard Experience
Get an overview of the recent improvements made to dashboards and how to take advantage of the newest functionality in Allstacks.
Make dashboards the gift that keeps on giving
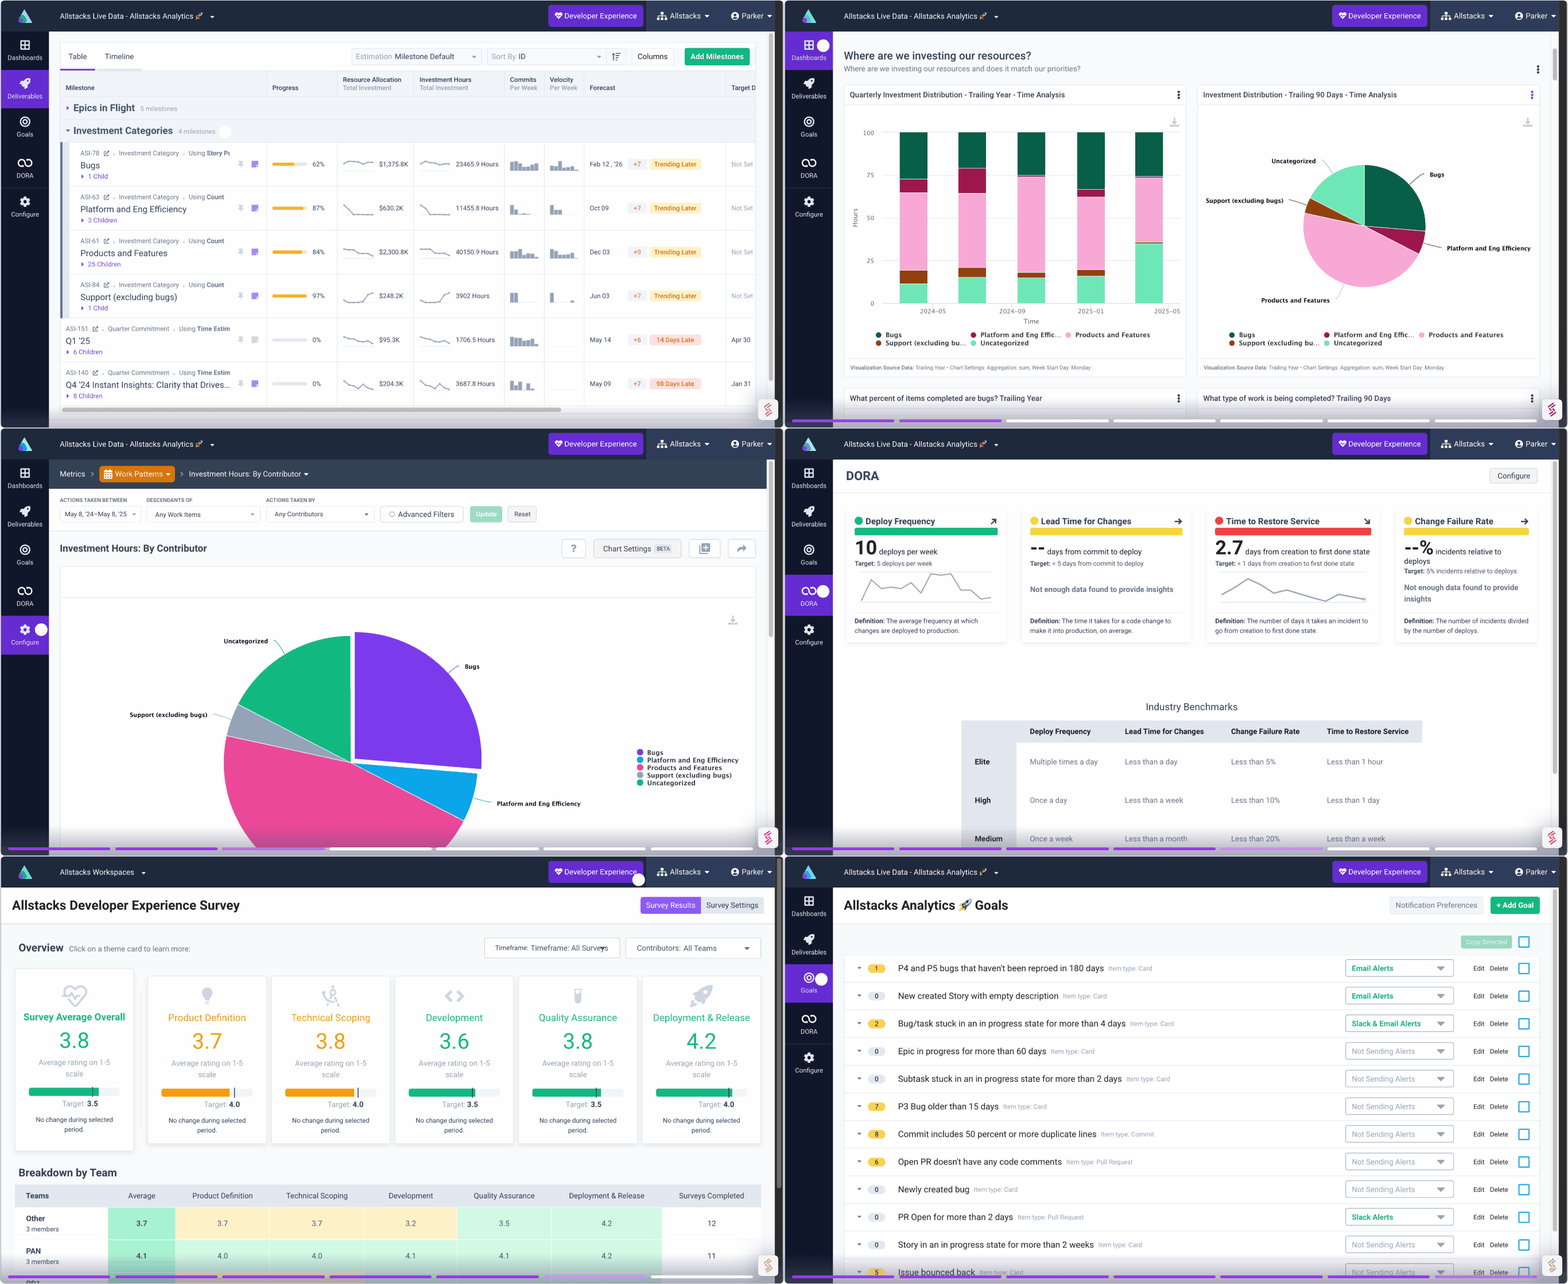
As the year end approaches, we’re excited to share a revamped dashboard experience that brings together a ton of great work by the Allstacks product and engineering teams over the course of 2023. It started by adding the ability to easily copy dashboards to share with one or more teams in just a few clicks over the summer, followed by the option to create custom dashboard templates and distribute them for all of your teams to view in their respective workspaces. Then, we shipped a highly requested feature by our customers: the ability to quickly filter dashboards by people and tags.
All of this great work led to where we are today – a place where our revamped dashboards in Allstacks now take on a more interactive role, helping engineering leaders instantiate their day-to-day world with data and have the answers to those “questions in the boardroom” at the ready in order to deliver better software, faster.
Templatize, distribute, save and filter seamlessly in the app
Each development team has different levels of maturity, tools, and unique aspects about their workflow. This can add extra steps when scaling out a new solution, but our goal is to make adoption as painless as possible. Now, not only can you templatize, distribute, save, and filter dashboards seamlessly, you can combine the power of these capabilities to bring everyone together and make adoption at scale easier.
Dashboard templates become even more powerful when used in conjunction with savable filters, enabling teams who are using more complex filters to share them with others in a couple of clicks. This saves a ton of time that would otherwise be spent recreating dashboards and configuring filters manually. It also gives leadership a single pane of glass to view pertinent information without having to jump into different workspaces for each team, making it easier to move between team hierarchies.
Here's a quick video overview of how the revamped dashboard experience comes together:
Give it a try
If you’re looking for ideas, try using the revamped dashboard experience to analyze all of your different "buckets" and identify bottlenecks across teams. Build a dashboard template that compares velocity across teams for planned work, maintenance work, and other delivery items like issues/epics in order to see where work gets blocked or slows down. Or, create quarterly comparisons to see issue completion by work item type (bug, story, task, customer request, etc.) to how much time teams’ spend on bugs vs value-add projects.
As always, we’d love your feedback. How are you using dashboards today? Send a note to parker@allstacks.com with any feedback that can help us improve. Until next time!
Find out what Allstacks can do to help you and your teams. Book a demo today.

