.png)


Company News
Stay up to date with the latest functionality available in Allstacks in this edition of our product update for September-October 2023.

Fall is in full swing and we’re excited to share what the team has been working on over the past few weeks. Updates include the option to create custom, auto-syncing dashboard templates, create custom portfolio columns, and the ability to filter dashboards by both people and tags. We’ve also shipped several brand new features in beta that you can take advantage of by speaking with your account team to request access. Find more details below.
Create custom dashboard templates and automatically share changes with all your teams
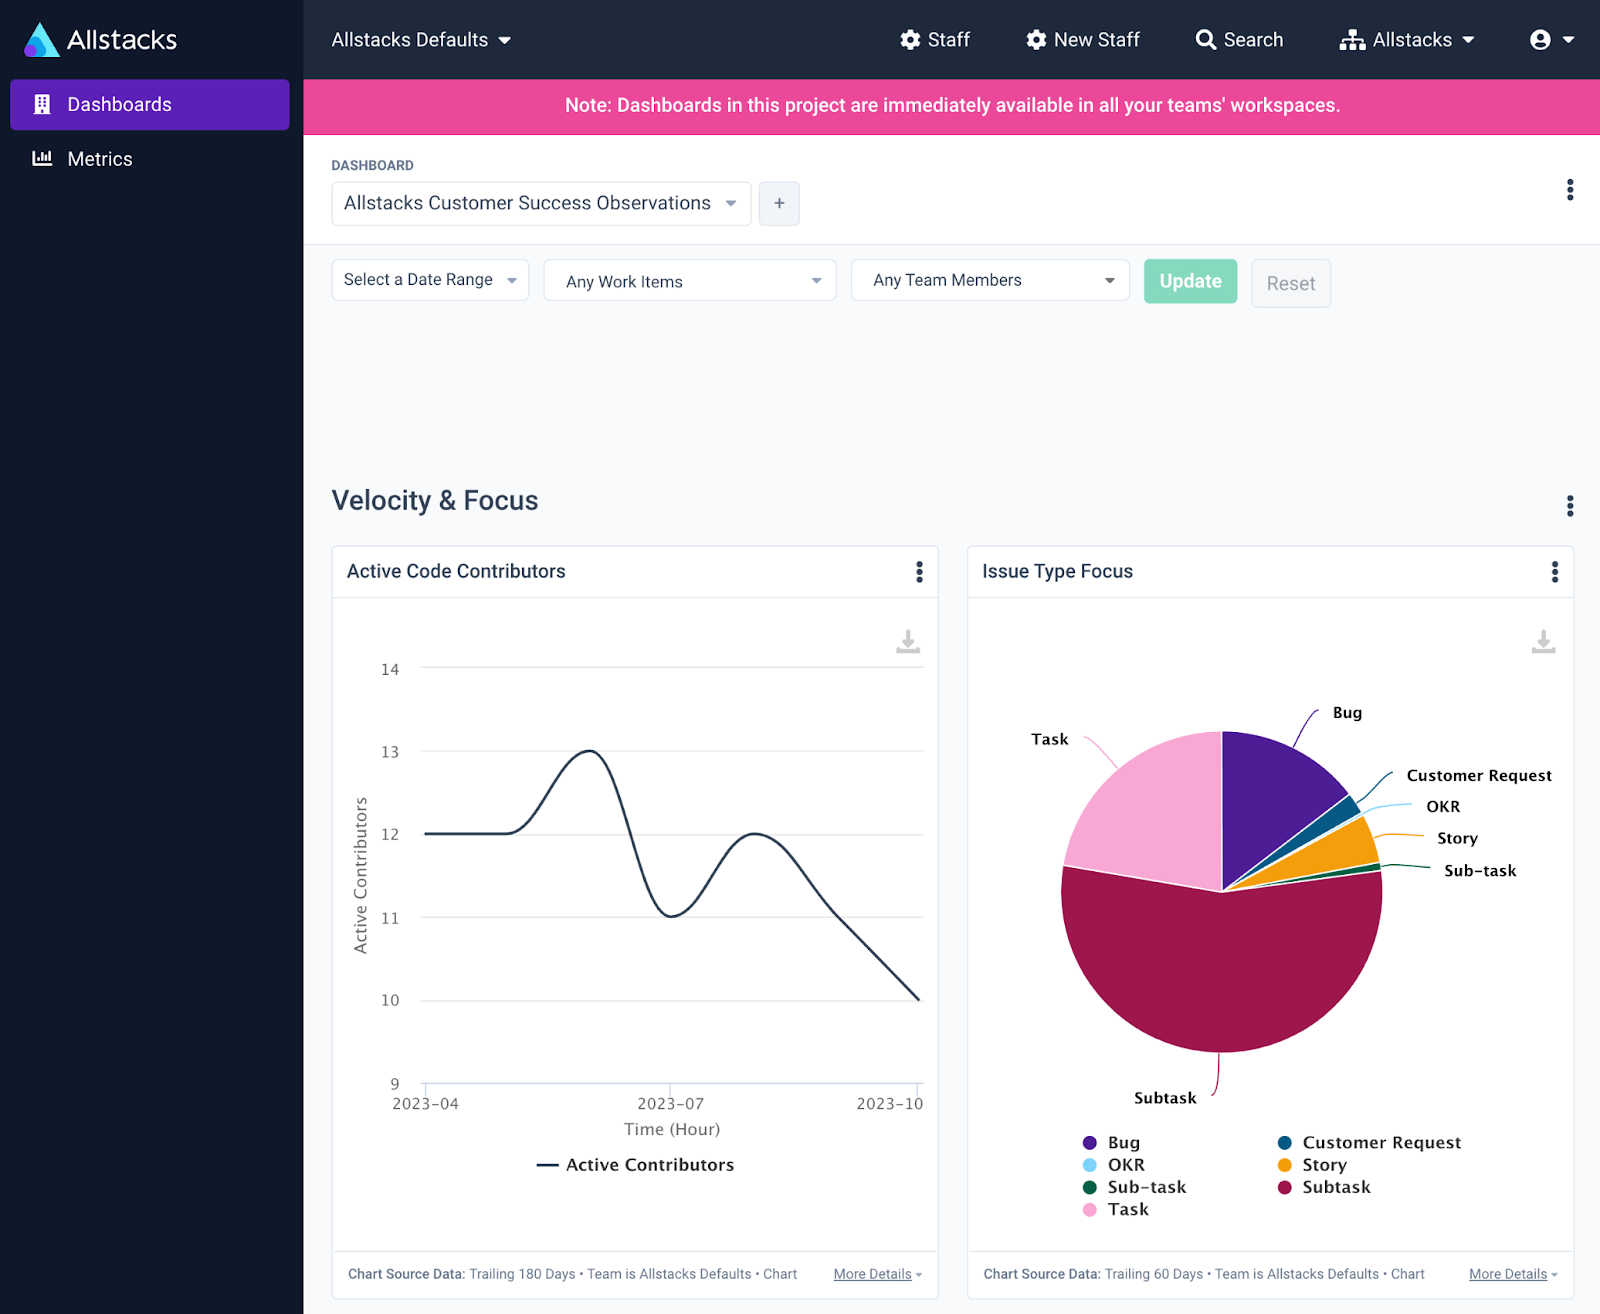
You now have the ability to create and update a core set of dashboards that all of your teams in Allstacks can access in their respective workspaces. There’s a new workspace in every organization for managing these newly created distributed dashboards. Any changes to the original dashboard made in the org-level workspace are automatically applied to dashboards in every teams’ workspace. Teams can copy these templates to make customized versions as needed in a couple of clicks.
Why is this important?
- Less overhead: Newly created projects start out with template dashboards to minimize the amount of manual intervention needed to propagate changes across teams
- Time to value: Existing projects can also take advantage of this functionality to get newly onboarded teams to value realization quickly
- Time savings: Updates are immediately visible to all teams when a change is made in the parent project with the template dashboard
Add custom fields as columns in the portfolio report
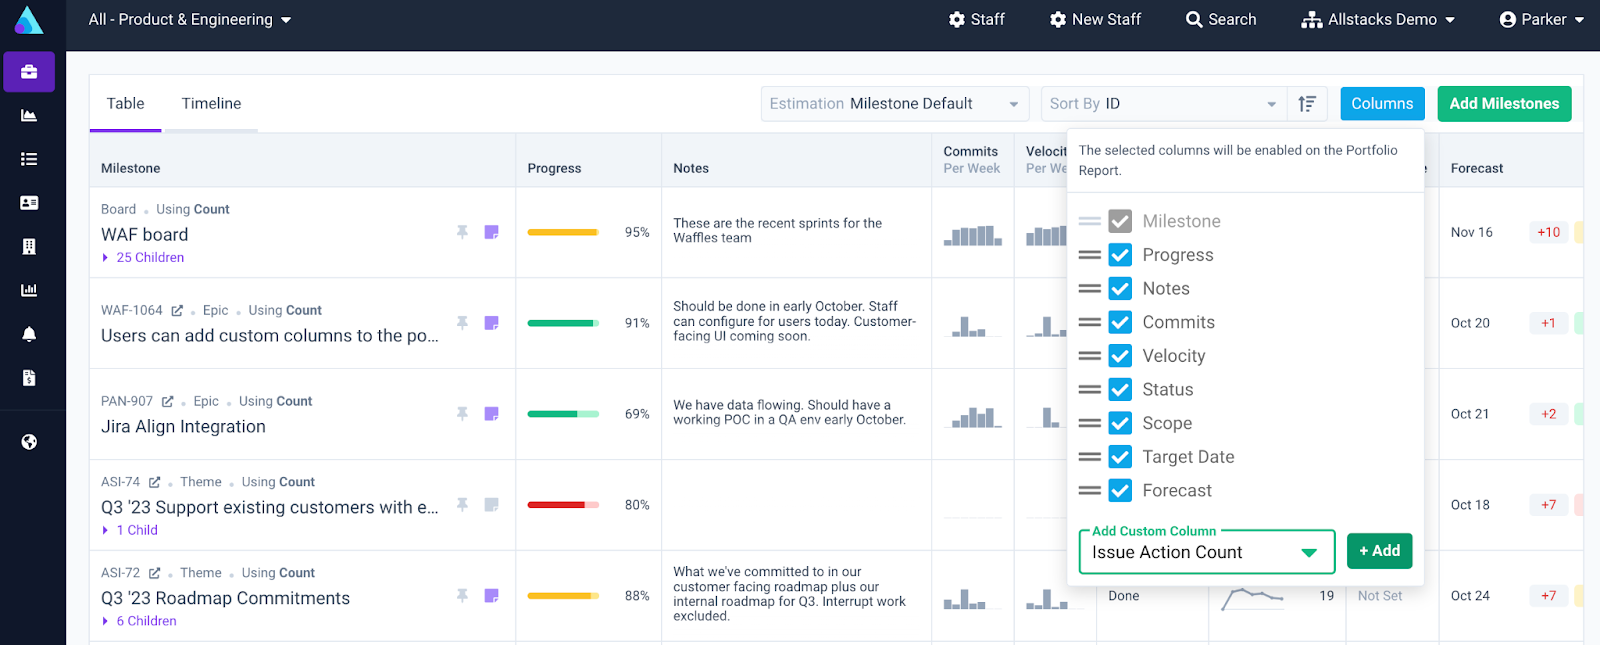
Easily create custom fields as columns in the portfolio report, enable the appropriate columns directly in the UI, and organize the columns to display the most pertinent data first. Get to the information that you care about faster and provide visibility into key metrics across teams, or even add notes with additional context to help your teammates understand the current state of deliverables.
Why is this important?
- Tailored views: Configure your portfolio report to surface the right information with the right context, reducing unnecessary noise and clutter
- Improved focus and visibility: Ensure you’re focused on the right data points and improve cross-team visibility into the state of deliverables in a single location
Filter dashboards by people and tags
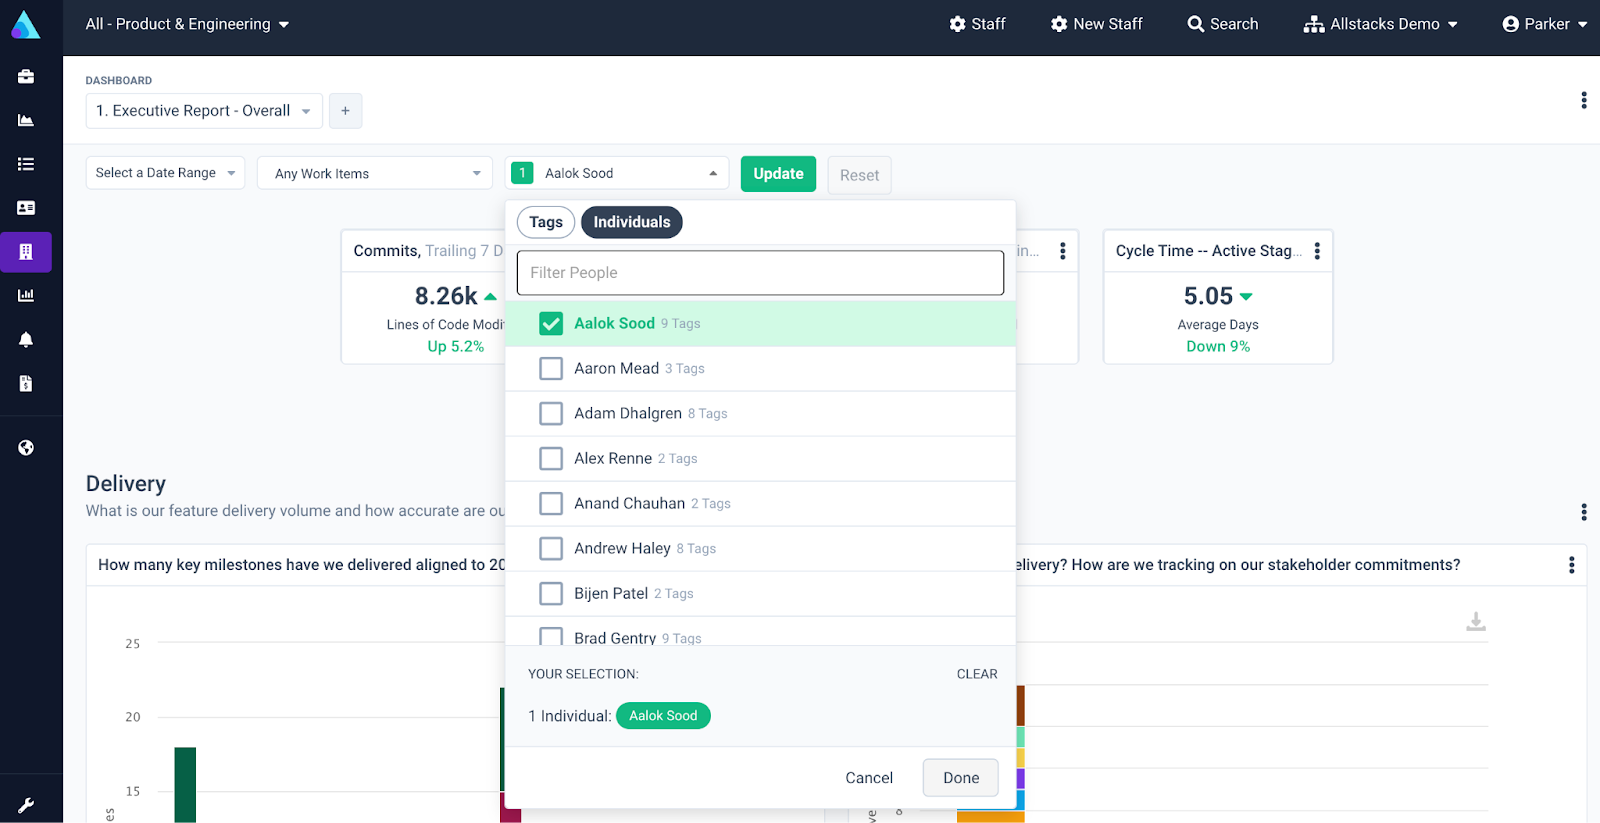
A highly requested feature by customers, you can now quickly filter dashboards by people and tags in the app. Tags in Allstacks represent teams or departments, contractors vs. FTEs, and different roles throughout your organization. Use this feature on your favorite dashboards to zoom in on a team without having to go to a different dashboard or workspace. You can also zoom all the way on an individual for 1:1s and performance reviews.
Why is this important?
- Gain time back: When sorting through team rosters, filtering by tags eliminates the need to create additional personalized workspace dashboards up front, making it easier and faster for setup teams to hit the ground running within the app
- More granular filtering: More powerful, flexible filtering gives you control over how you configure and present dashboards
Next, we will be adding advanced filters to dashboards and the ability to save filter combinations for quick recall.
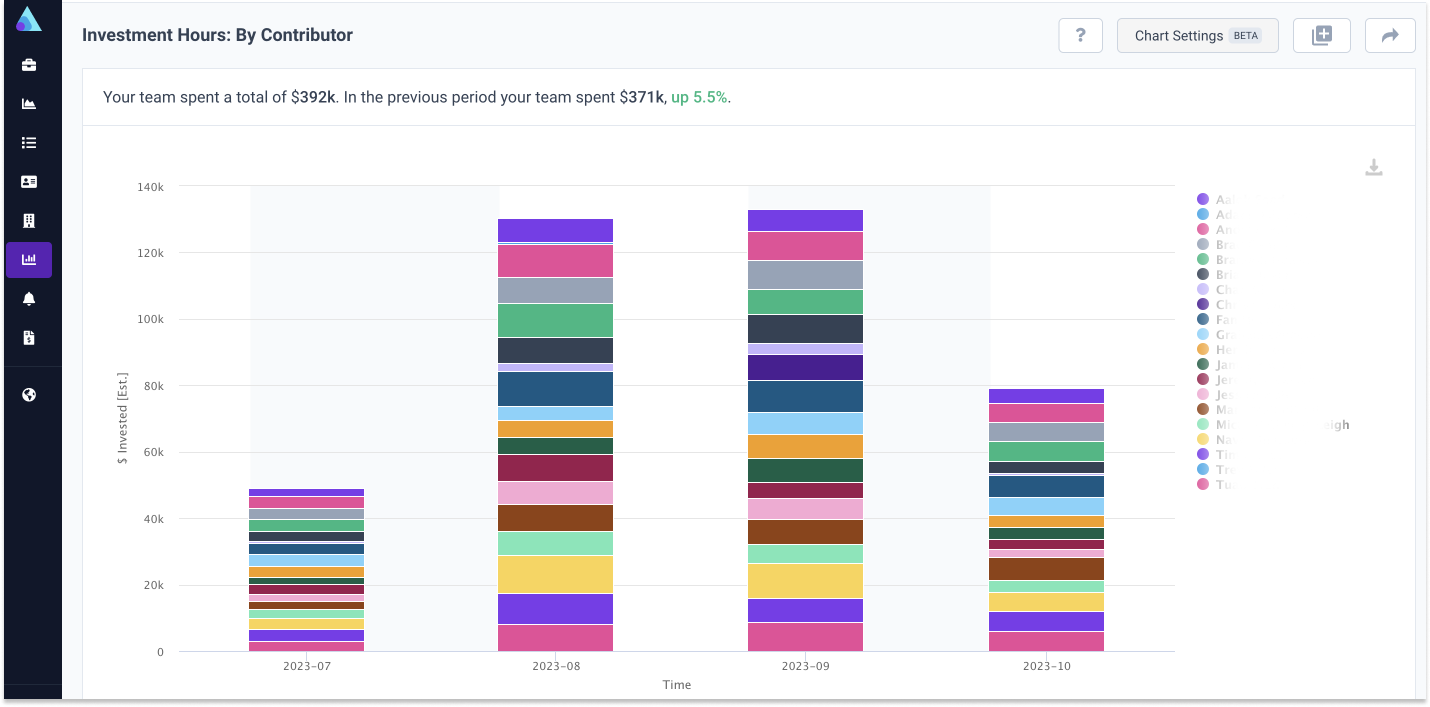
Know where you’re investing with the resource allocations metric (beta)
Take advantage of our new resource allocations metric in Allstacks to estimate development costs based on your average salaries and the hours invested by your engineers. The beta release of this functionality allows you to view your engineering investments through a new paradigm and better understand how you’re delivering value with real dollar amounts attached.
Why is this important?
- Know your ROI: Get a clear line of sight into your potential ROI and payback when working on a given feature or deliverable based on real financial data
- Build with confidence: Understand where you’re investing resources, both human and financial, to determine what to build or what not to build with a higher degree of confidence in the potential impact the work will have on the business at-large
To get access to this beta functionality, reach out to your account team.
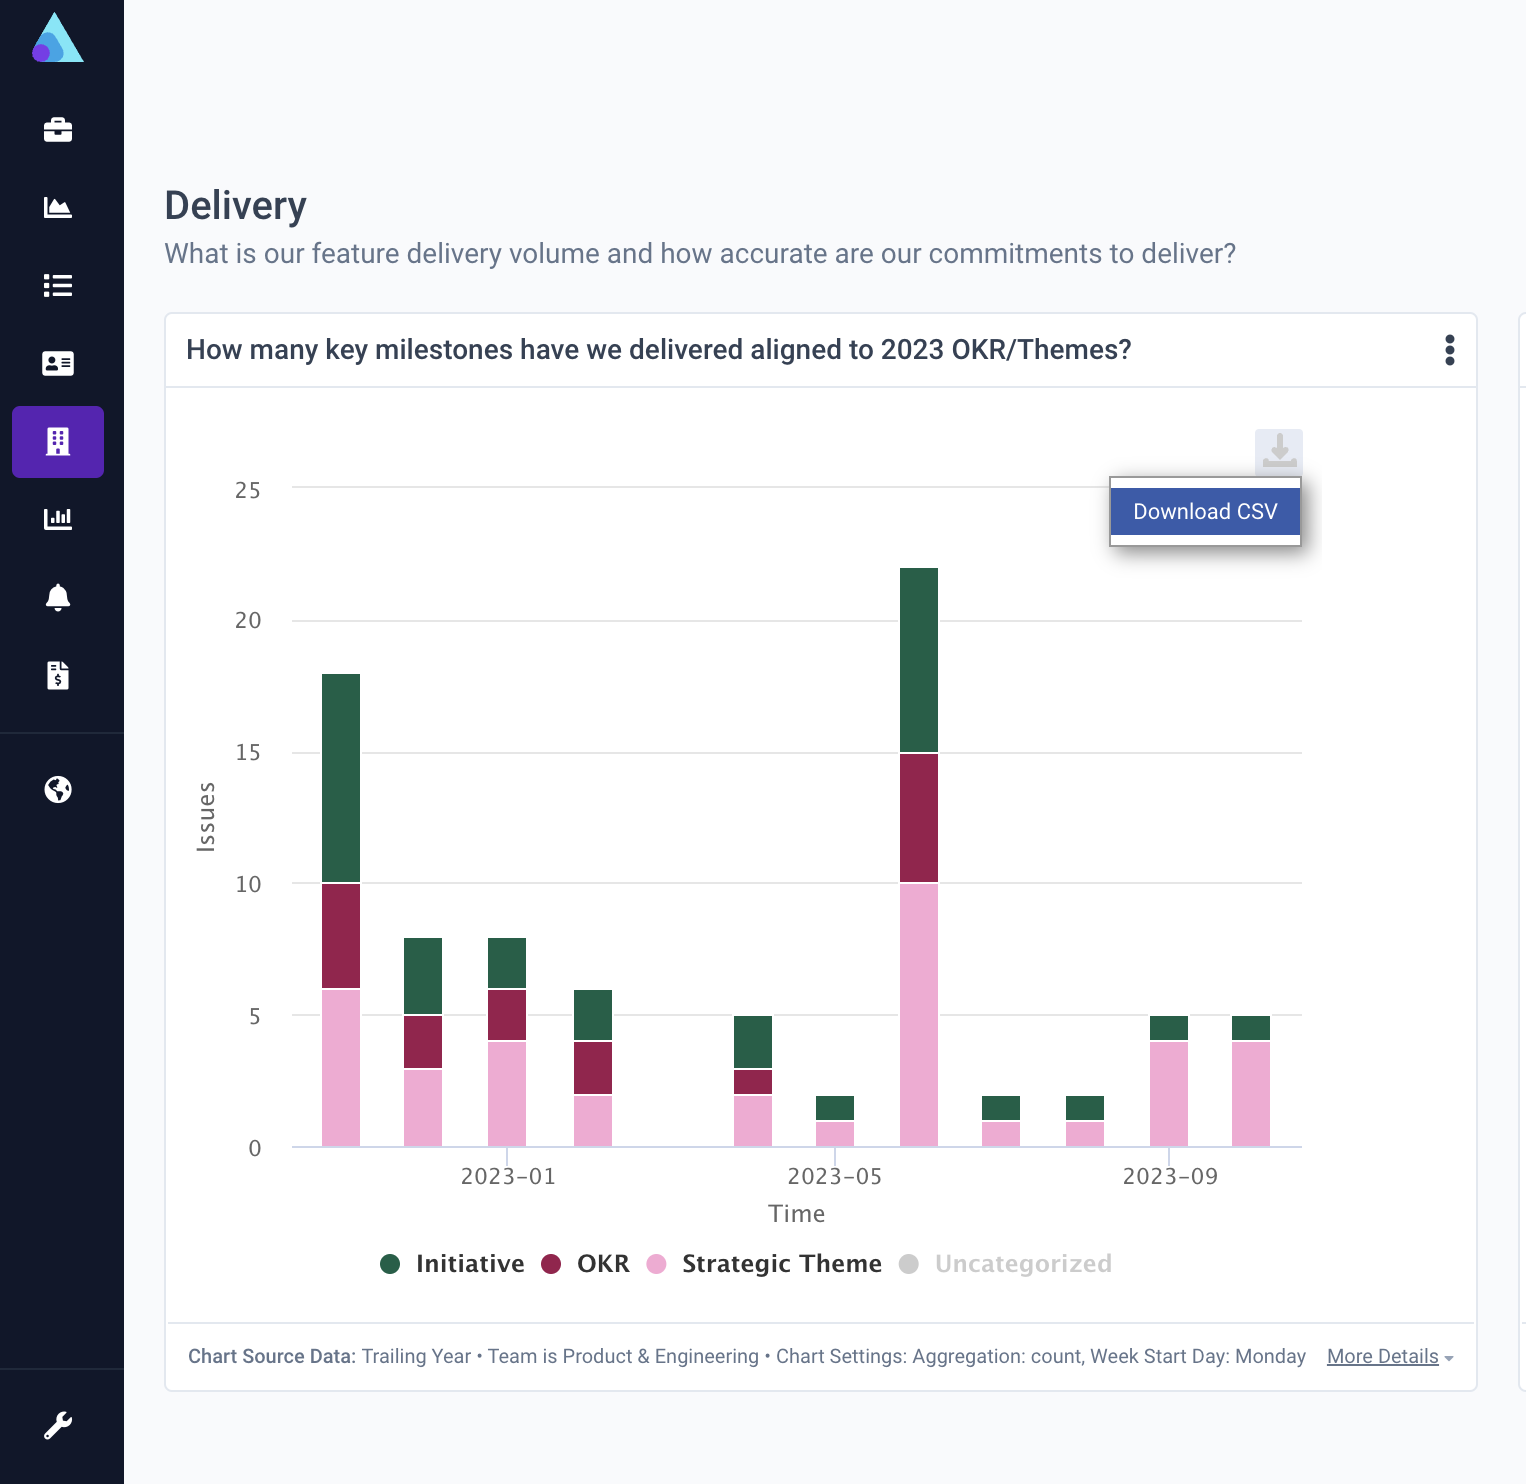
Download chart data via .csv (beta)
Another highly requested feature, you can now download chart data from metrics on your dashboards as a .csv file. To download the .csv file, simply click the “download” icon in the top right hand corner of any metric you’d like to export into a spreadsheet and then locate the file in your downloads folder.
Why is this important?
- Share outside of the app: Quickly and easily download chart data from the visualization you’re viewing to share with the rest of your organization or teams without requiring access to Allstacks itself
- Retain snapshots: Retain a snapshot of a dashboard’s visualization data for a specific period of time
- Customizability: Fine tune the presentation of the data in your favorite chart building tool, using your own brand colors, sorting columns, taking out distracting outliers, etc.
To get access to this beta functionality, reach out to your account team.
Integrate Jira Align with Allstacks (beta)
We’re excited to share that we’ve added beta support for Jira Align to integrate with Allstacks. For this initial release, metrics can be grouped by the Jira Align features that are associated with a particular work item in Jira Align. Jira Align features can also be pinned to the portfolio report directly in Allstacks.
Why is this important?
- Fast results: While undergoing transformation initiatives or implementing a long term strategy with Jira Align, connect your instance to Allstacks and start seeing results in less than 48 hours while you continue working on longer-term projects
- No tradeoffs: Get the best of both worlds without sacrificing quality or speed. If you’ve got teams using different development tools, Allstacks can ingest and normalize that data without requiring you to restructure your agile workflow or migrate tools
To get access to this beta functionality, reach out to your account team for early access.
Other performance enhancements and quality of life improvements:
- Faster load times for metrics
- Improved efficiency for ADO downloads
- General infrastructure updates
- Added support for Jenkins branch name filtering
- More granular filtering for Jenkins data
- Various bug fixes and maintenance tasks
We hope you enjoy these improvements! If you have any questions about this or any Allstacks functionality, don’t hesitate to reach out. Keep an eye on the release notes regularly to see what’s new.