.png)
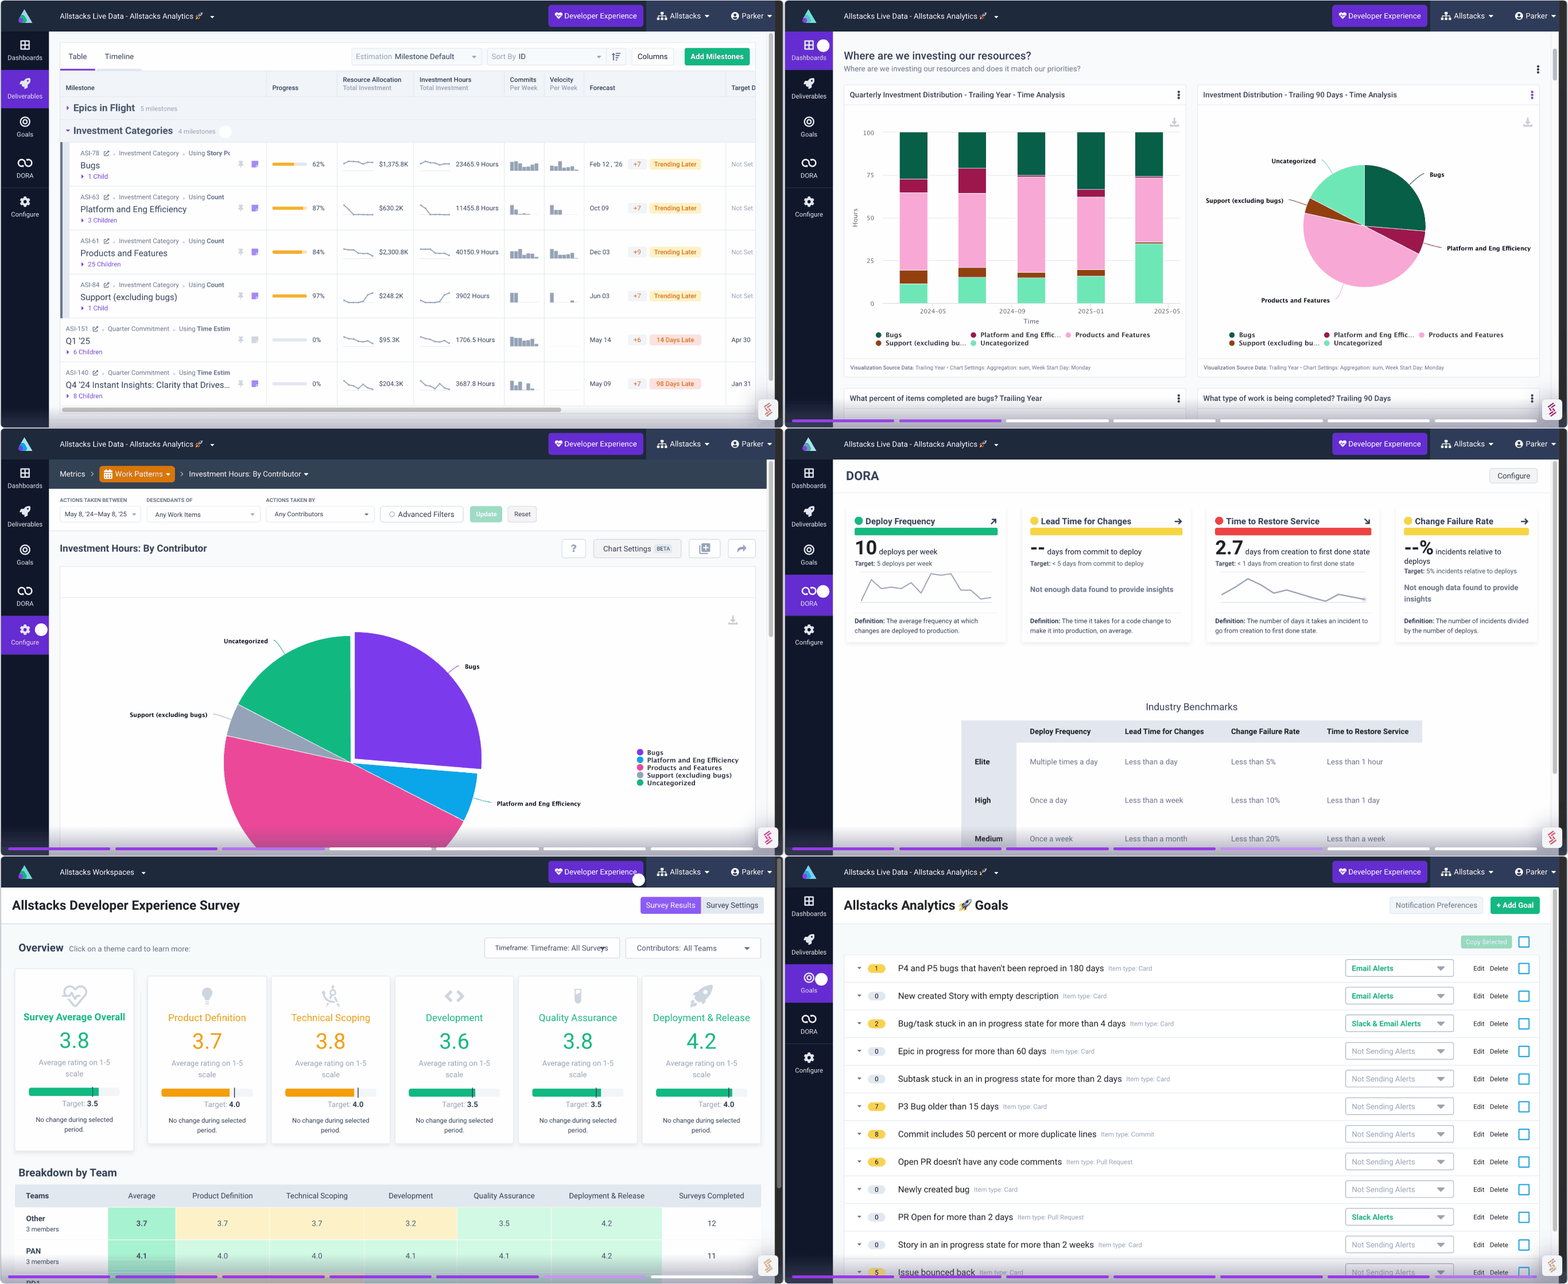
Software Engineering Intelligence
-
Intelligence Engine
On-demand exhaustive AI-analysis
-
Engineering Investment
Complete visibility into time & dollars spent
-
360º Insights
Create meaningful reports and dashboards
-
Project Forecasting
Track and forecast all deliverables
DevEx
-
Developer Surveys
Create and share developer surveys
Software Capitalization
-
R&D Capitalization Reporting
Align and track development costs
Highlighted Feature: View your Portfolio as a Timeline [Gantt Chart]
The new Portfolio Timeline View leverages our automated, intelligent forecasting to visualize the gap between your target dates and the forecasted dates.
Until recently, engineering and product leaders created visualizations manually with spreadsheets, powerpoints, and project management tools to tell the story of how gets done and what stands in the way. Engineers also couldn't include forecasting information and recent activity indicators in these visualizations, and because of this, they often drifted out of sync with reality soon after creation.
Allstacks' Portfolio Timeline View changes the game. It leverages our automated, intelligent forecasting to visualize the gap between your target dates and the forecasted dates and the alignment of dependencies. With one click, you can visualize your portfolio as a Gantt chart to:
- See in sharp relief which items are most off-track from your target dates or most question-raising
- Click through to find the root problems and more quickly triage the bottlenecks
To see these updates and more, schedule a demo with the team. Already a customer? Log in and toggle to the Timeline View now.
This is only the beginning. Check out the Portfolio Report Roadmap.
This release marks the beginning of a new way to visualize and manage your milestones. Here is a look at our roadmap for the enhancements coming to the Portfolio Report.
Parent/Parent/Child Nesting
Easily move from parent-level milestone reporting to investigating children such as sub-initiatives, components, or epics to see what dependencies impact the overall delivery forecast and progress on your key initiatives.
Activity Visualization
Before, the Table View gives you key activity pulses and trend indicators. Now, we're bringing this data and more to the timeline view, incorporating coding and project management activity to help you visualize what actions are being taken against your key milestones, whether they match expectations, and how they match your progress.
Table View Enhancements
We've upgraded the Table View UI to deliver better data inquiry, incorporate child nesting, coding activity, and sorting by column.
Visualize Dependency Linking
Our evergreen Gantt chart helps you understand the cascading effects of changes or delays in your initiatives and the corresponding impacts on downstream work, teams, and stakeholders—without any of the manual upkeep.
Building software is complex and highly sensitive to changes that make committing to dates difficult. The earlier you can detect misalignments, the more likely you can course-correct and avoid missed deadlines. The new Timeline view solves two challenges that product and software leaders have long struggled with — spotting misalignment early and demonstrating the status of roadmap commitments to the rest of the business.
Speaking of your roadmap, check out this blog for tips on using your company values to guide it.
We would love your feedback and to show you your strategic initiatives in our new Timeline View. Schedule a demo to see it in action and start your free 30-day trial.


