.png)


It’s been used since the early days of COBOL, and is still talked about today, though, almost always with a disparaging tone. It helps to understand a bit of history when talking about this age-old metric and why it has a bad reputation.
Almost all large software projects are measured by the number of lines of code they contain, and people typically talk about the size of their codebase to brag about their accomplishments. However, even early on, programmers argued about the “value” of a line of code. One line of code in the C programming language could equal twenty in Assembly. Even more confusingly, the same code could be written a dozen different ways each performing the same action, and each taking up different numbers of lines of code.
It’s easy to see why this metric is usually looked down on and even used as a joke by developers and managers alike. However, there are a few ways to look at this to learn valuable things about your team and your developers.
Looking at commit volume gives you a good look into how much code your team is writing.

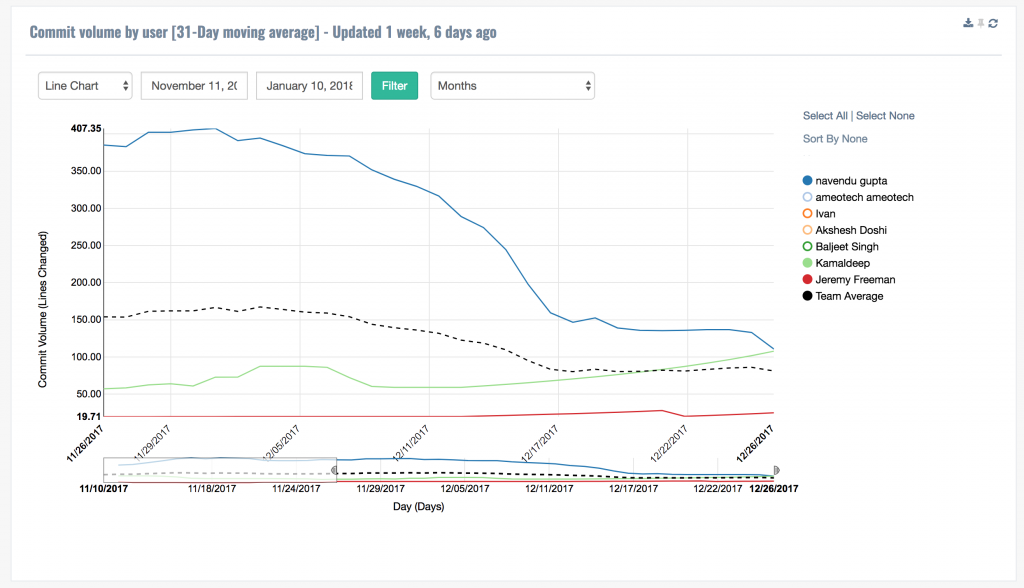
Let's start by taking a look at some commit data. The first thing to identify is that this data is presented with a 31-day moving average, a standard way of showing trends in very noisy data. This helps us understand how people are doing without getting into the details of the day-to-day variance. That’s the first point. One of the issues with looking at traditional commit volume is that a developer isn’t going to deliver 450 lines of code per day. It’s going to vary. One day, the developer may be working on a very critical algorithm bug where the fix is a single character, and the next they are working on a huge XML file that requires hundreds of lines of changes. Looking at this on average helps trends emerge.
Point 1: Commit volume has a high variance from day-to-day
You can see from the above data [our data, actually], that things got quiet around December. Our most prolific developer took some time off, the holidays slowed down progress in general, and our UI dev was able to churn through a backlog of charting bugs since I wasn’t, er, bugging him. This brings us to our second point. While one developer was creating 400 lines of code/day on average, another was creating 50. These two developers were putting in the same amount of effort but were working on very different parts of the application. It’s not fair to directly compare them by lines of code, but what is insightful is looking at how they compare to themselves. I can see the impact of a vacation, and I can also identify when a developer is hitting a wall.
Point 2: You can’t compare one developer's lines of code to another developer, but you can compare their lines of code to themselves
While the number of lines a developer creates isn’t always a great indicator of how they’re doing relative to other people, it can be a great way to identify how they’re doing relative to themselves. We also use this metric [Lines of Code or Commit Volume] to help contextualize some of the other data we report on, such as Code Type and Defects.
References:
https://en.wikipedia.org/wiki/Source_lines_of_code
https://informationisbeautiful.net/visualizations/million-lines-of-code/